Turn Risk Into
A Decision Advantage
Makhater 360 unifies the full risk lifecycle — register, assess, treat, monitor and report — in a single COSO/ISO 31000-aligned command center, built for enterprises that need to govern risk, not just catalog it.
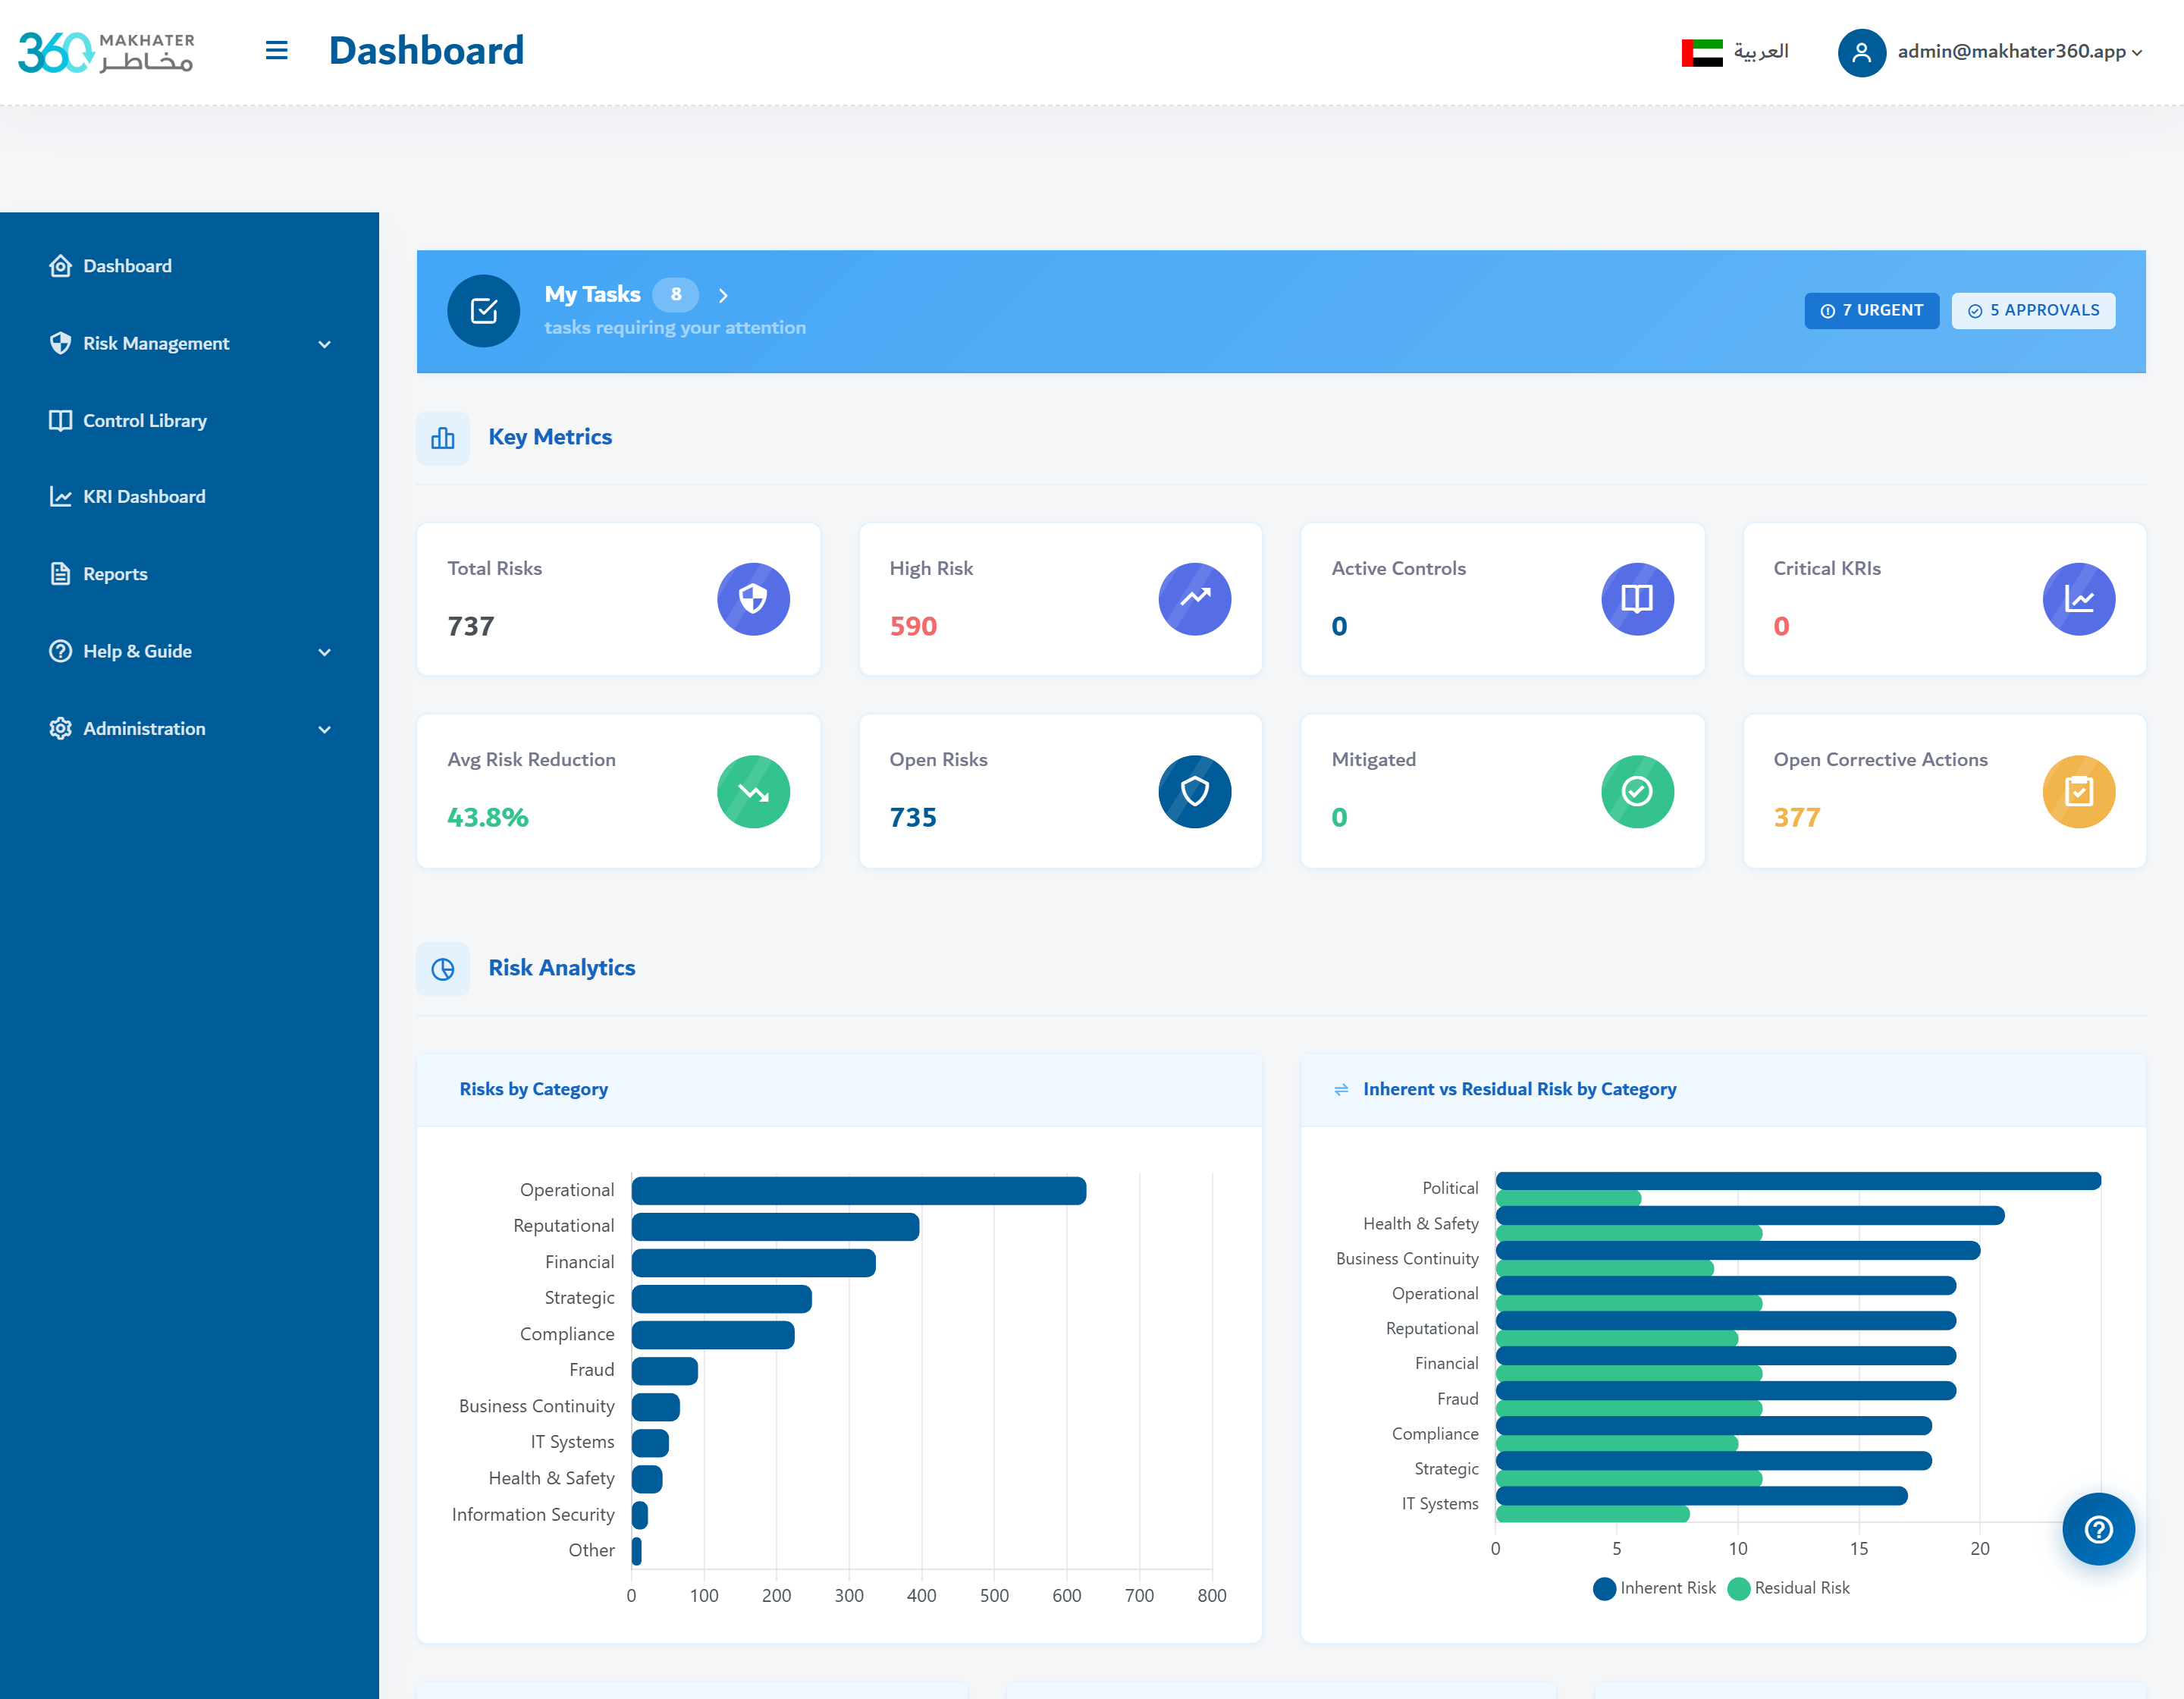
Everything Your Risk Program Needs
From registering a risk to closing the loop on treatment — Makhater 360 covers the full enterprise risk lifecycle in one connected, auditable system.
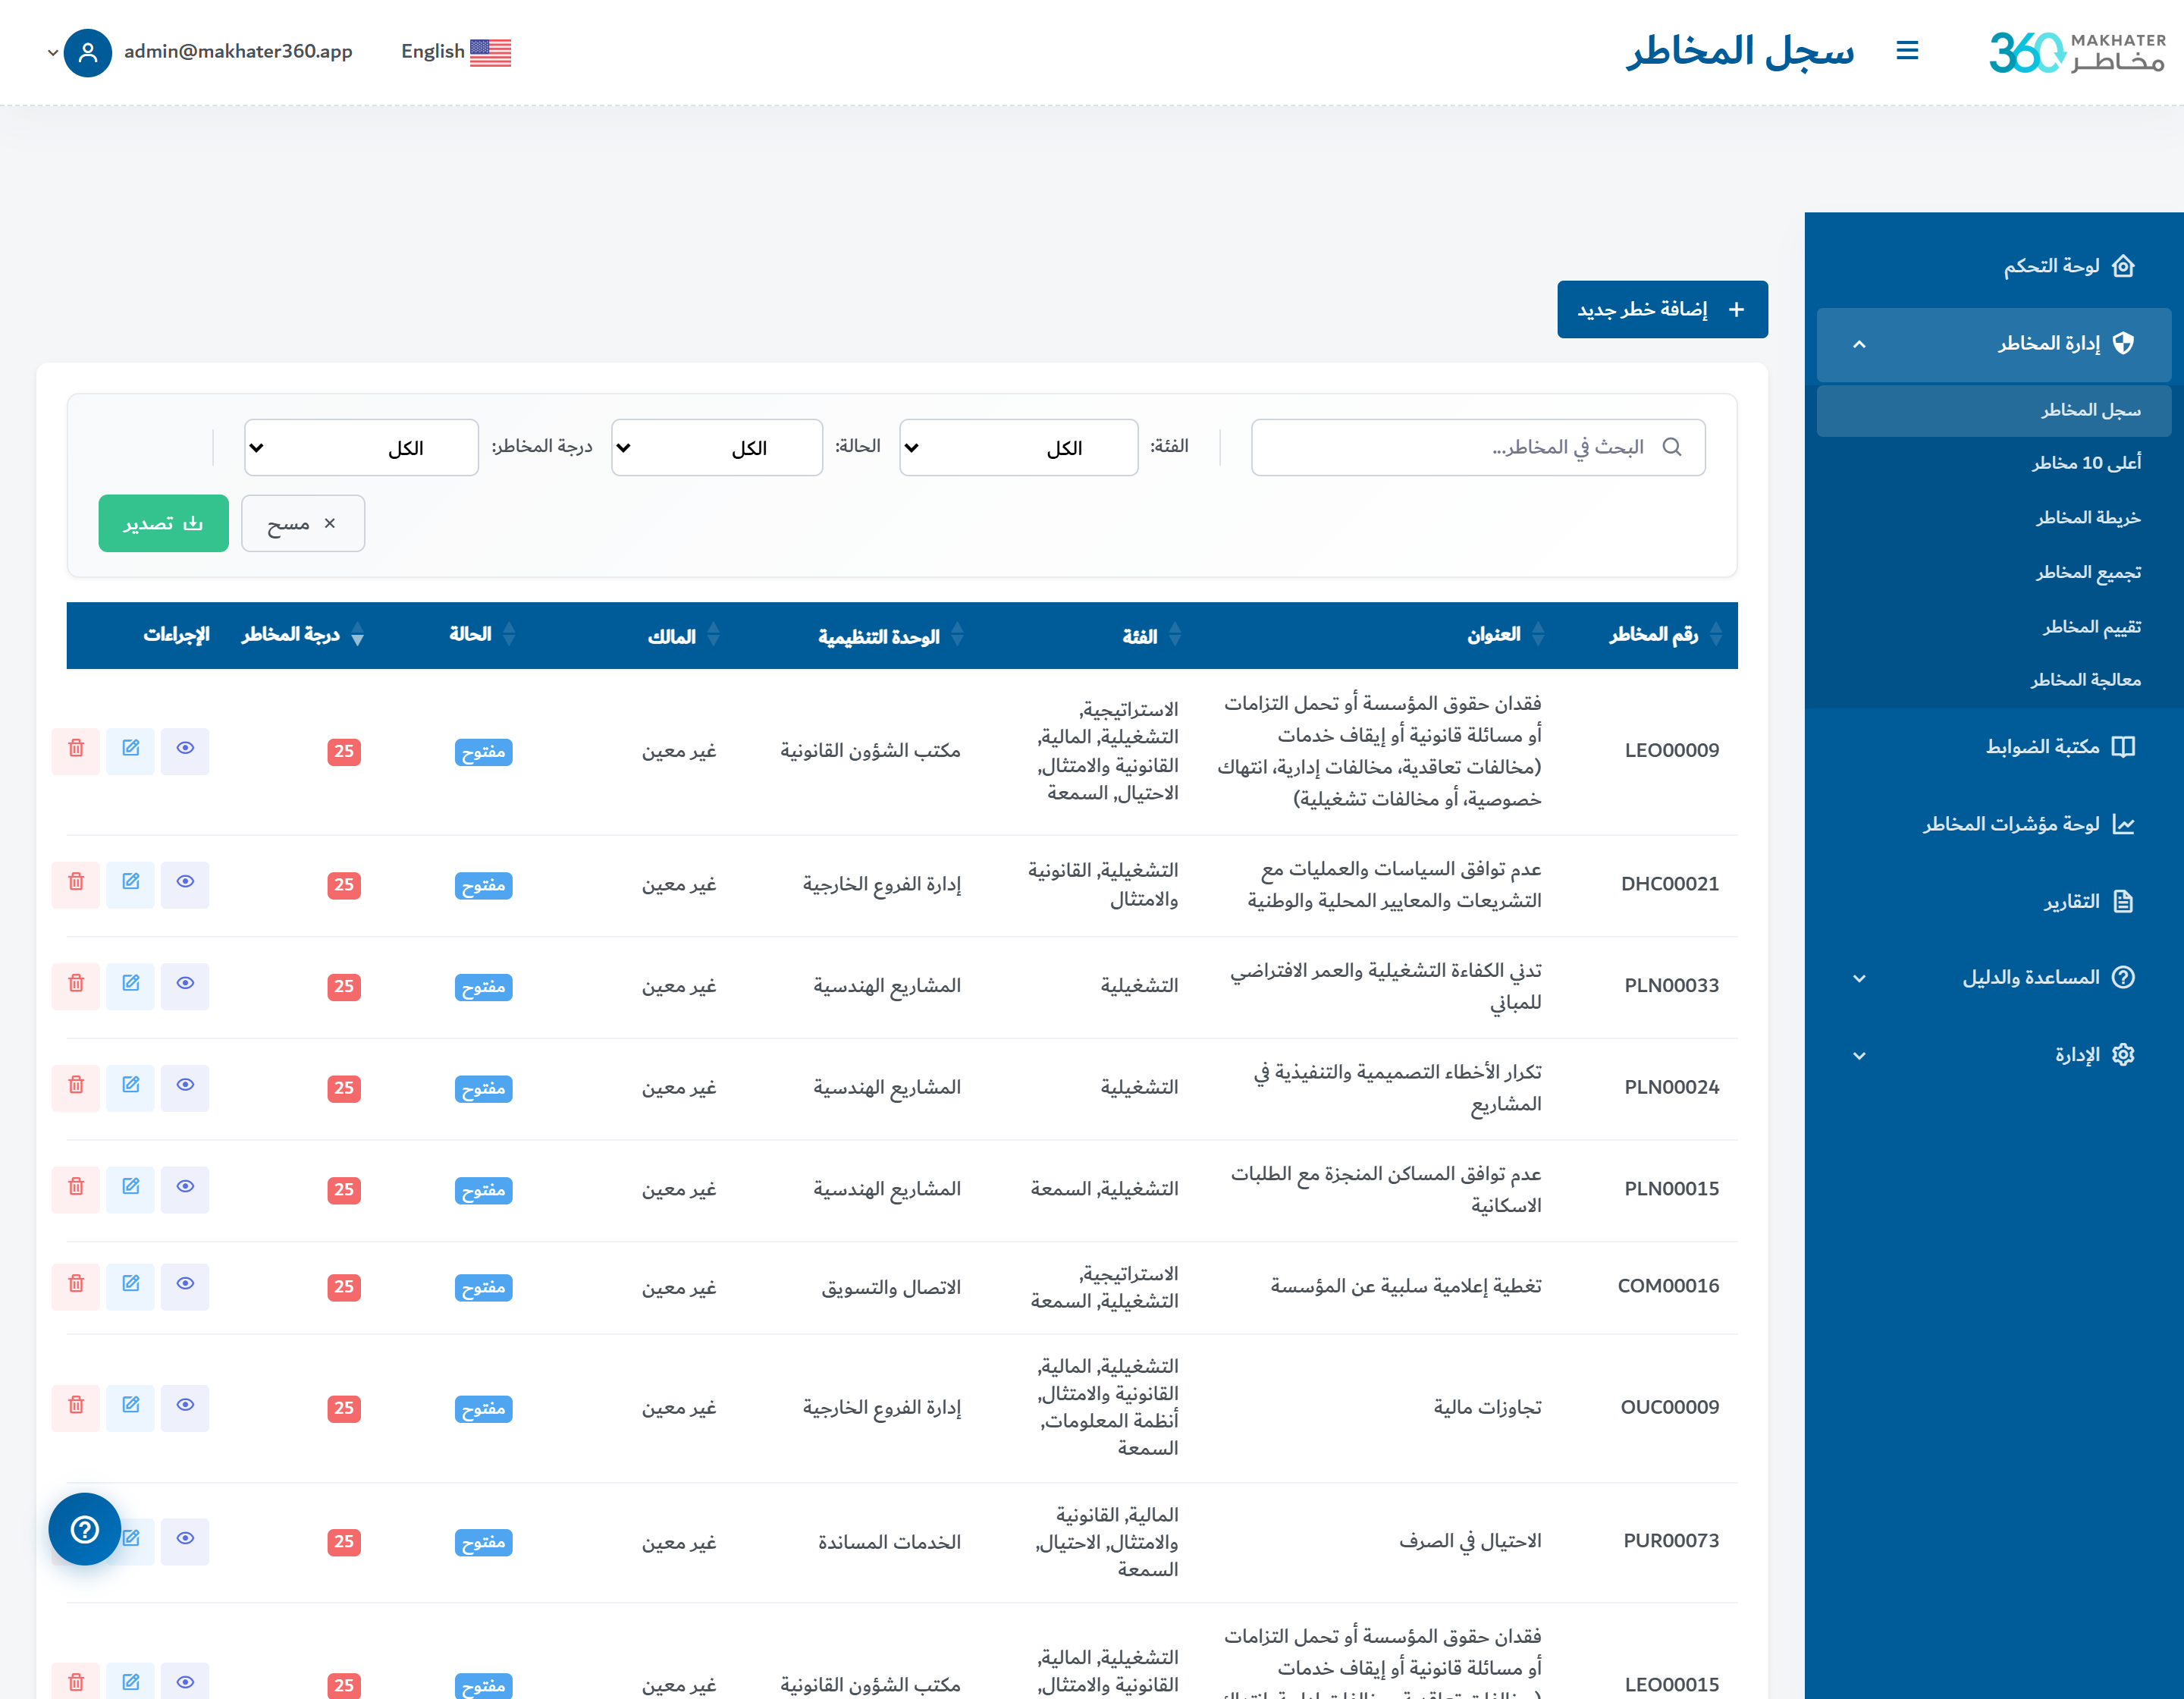
Risk Register
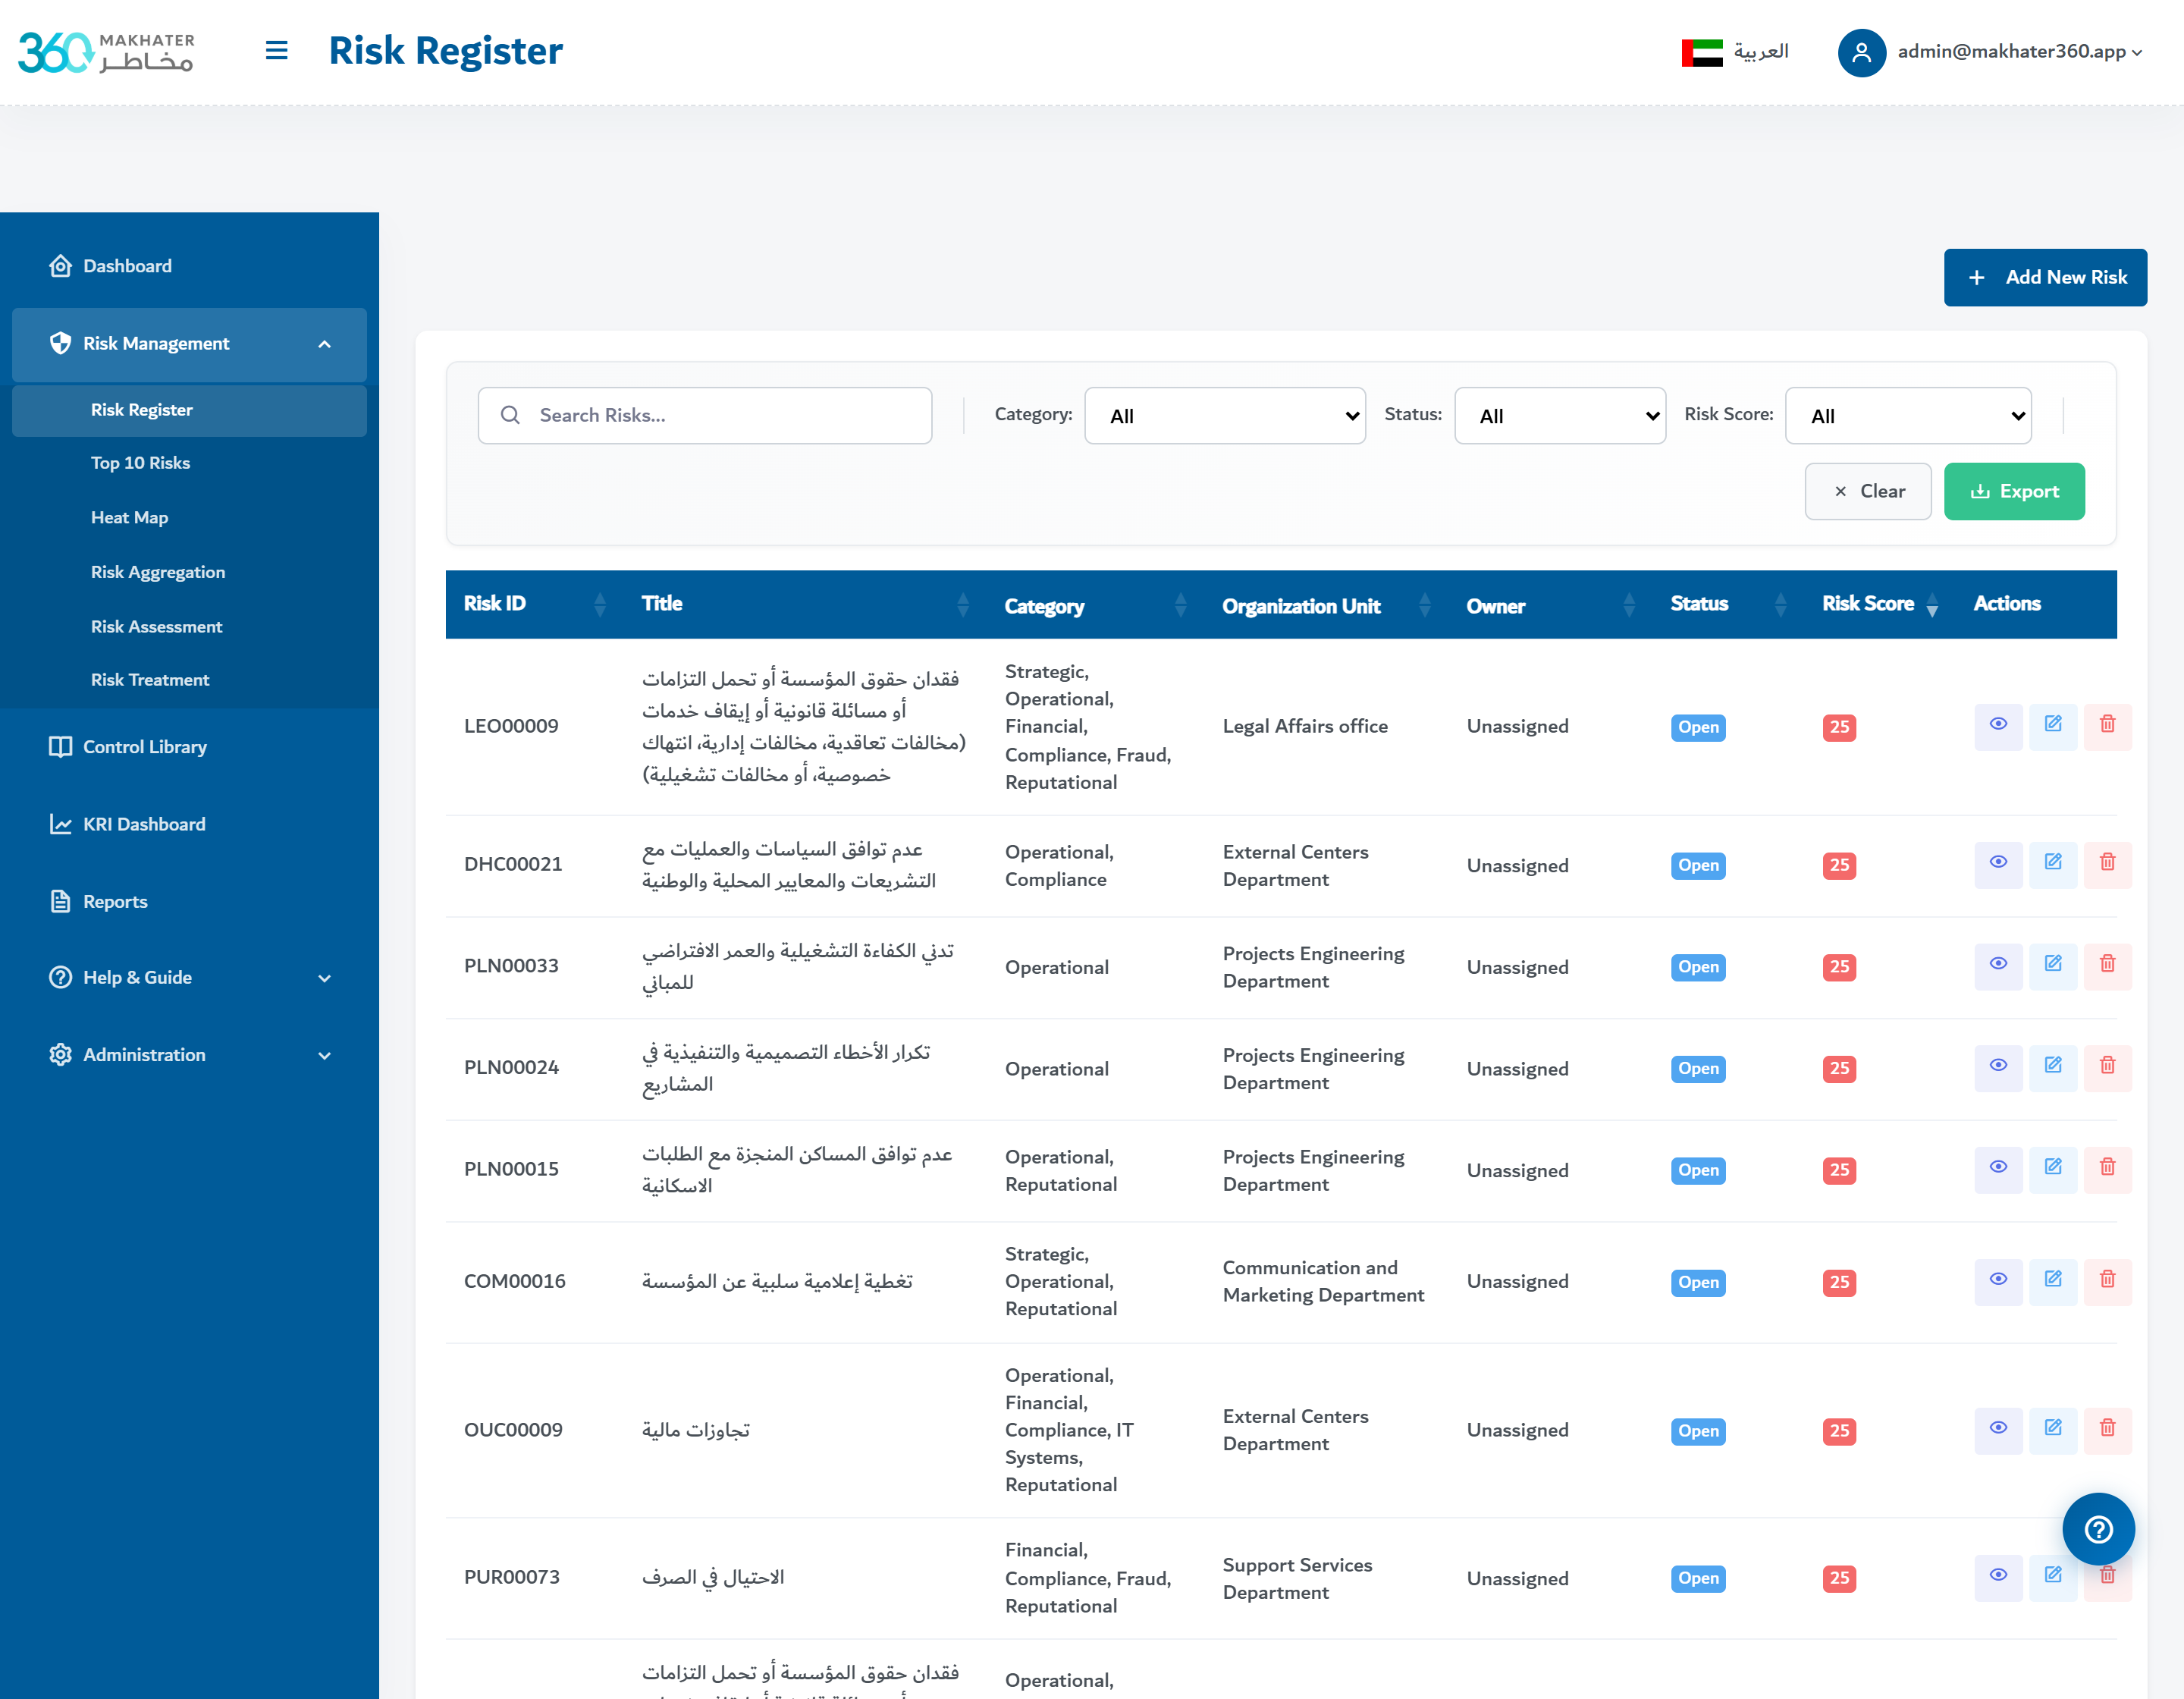
Capture every enterprise risk in one structured register — category, owning department, strategic objective, process linkage, inherent and residual scores, control status, treatment state and workflow step. The single source of truth every other Makhater 360 module builds on.
Risk Assessment
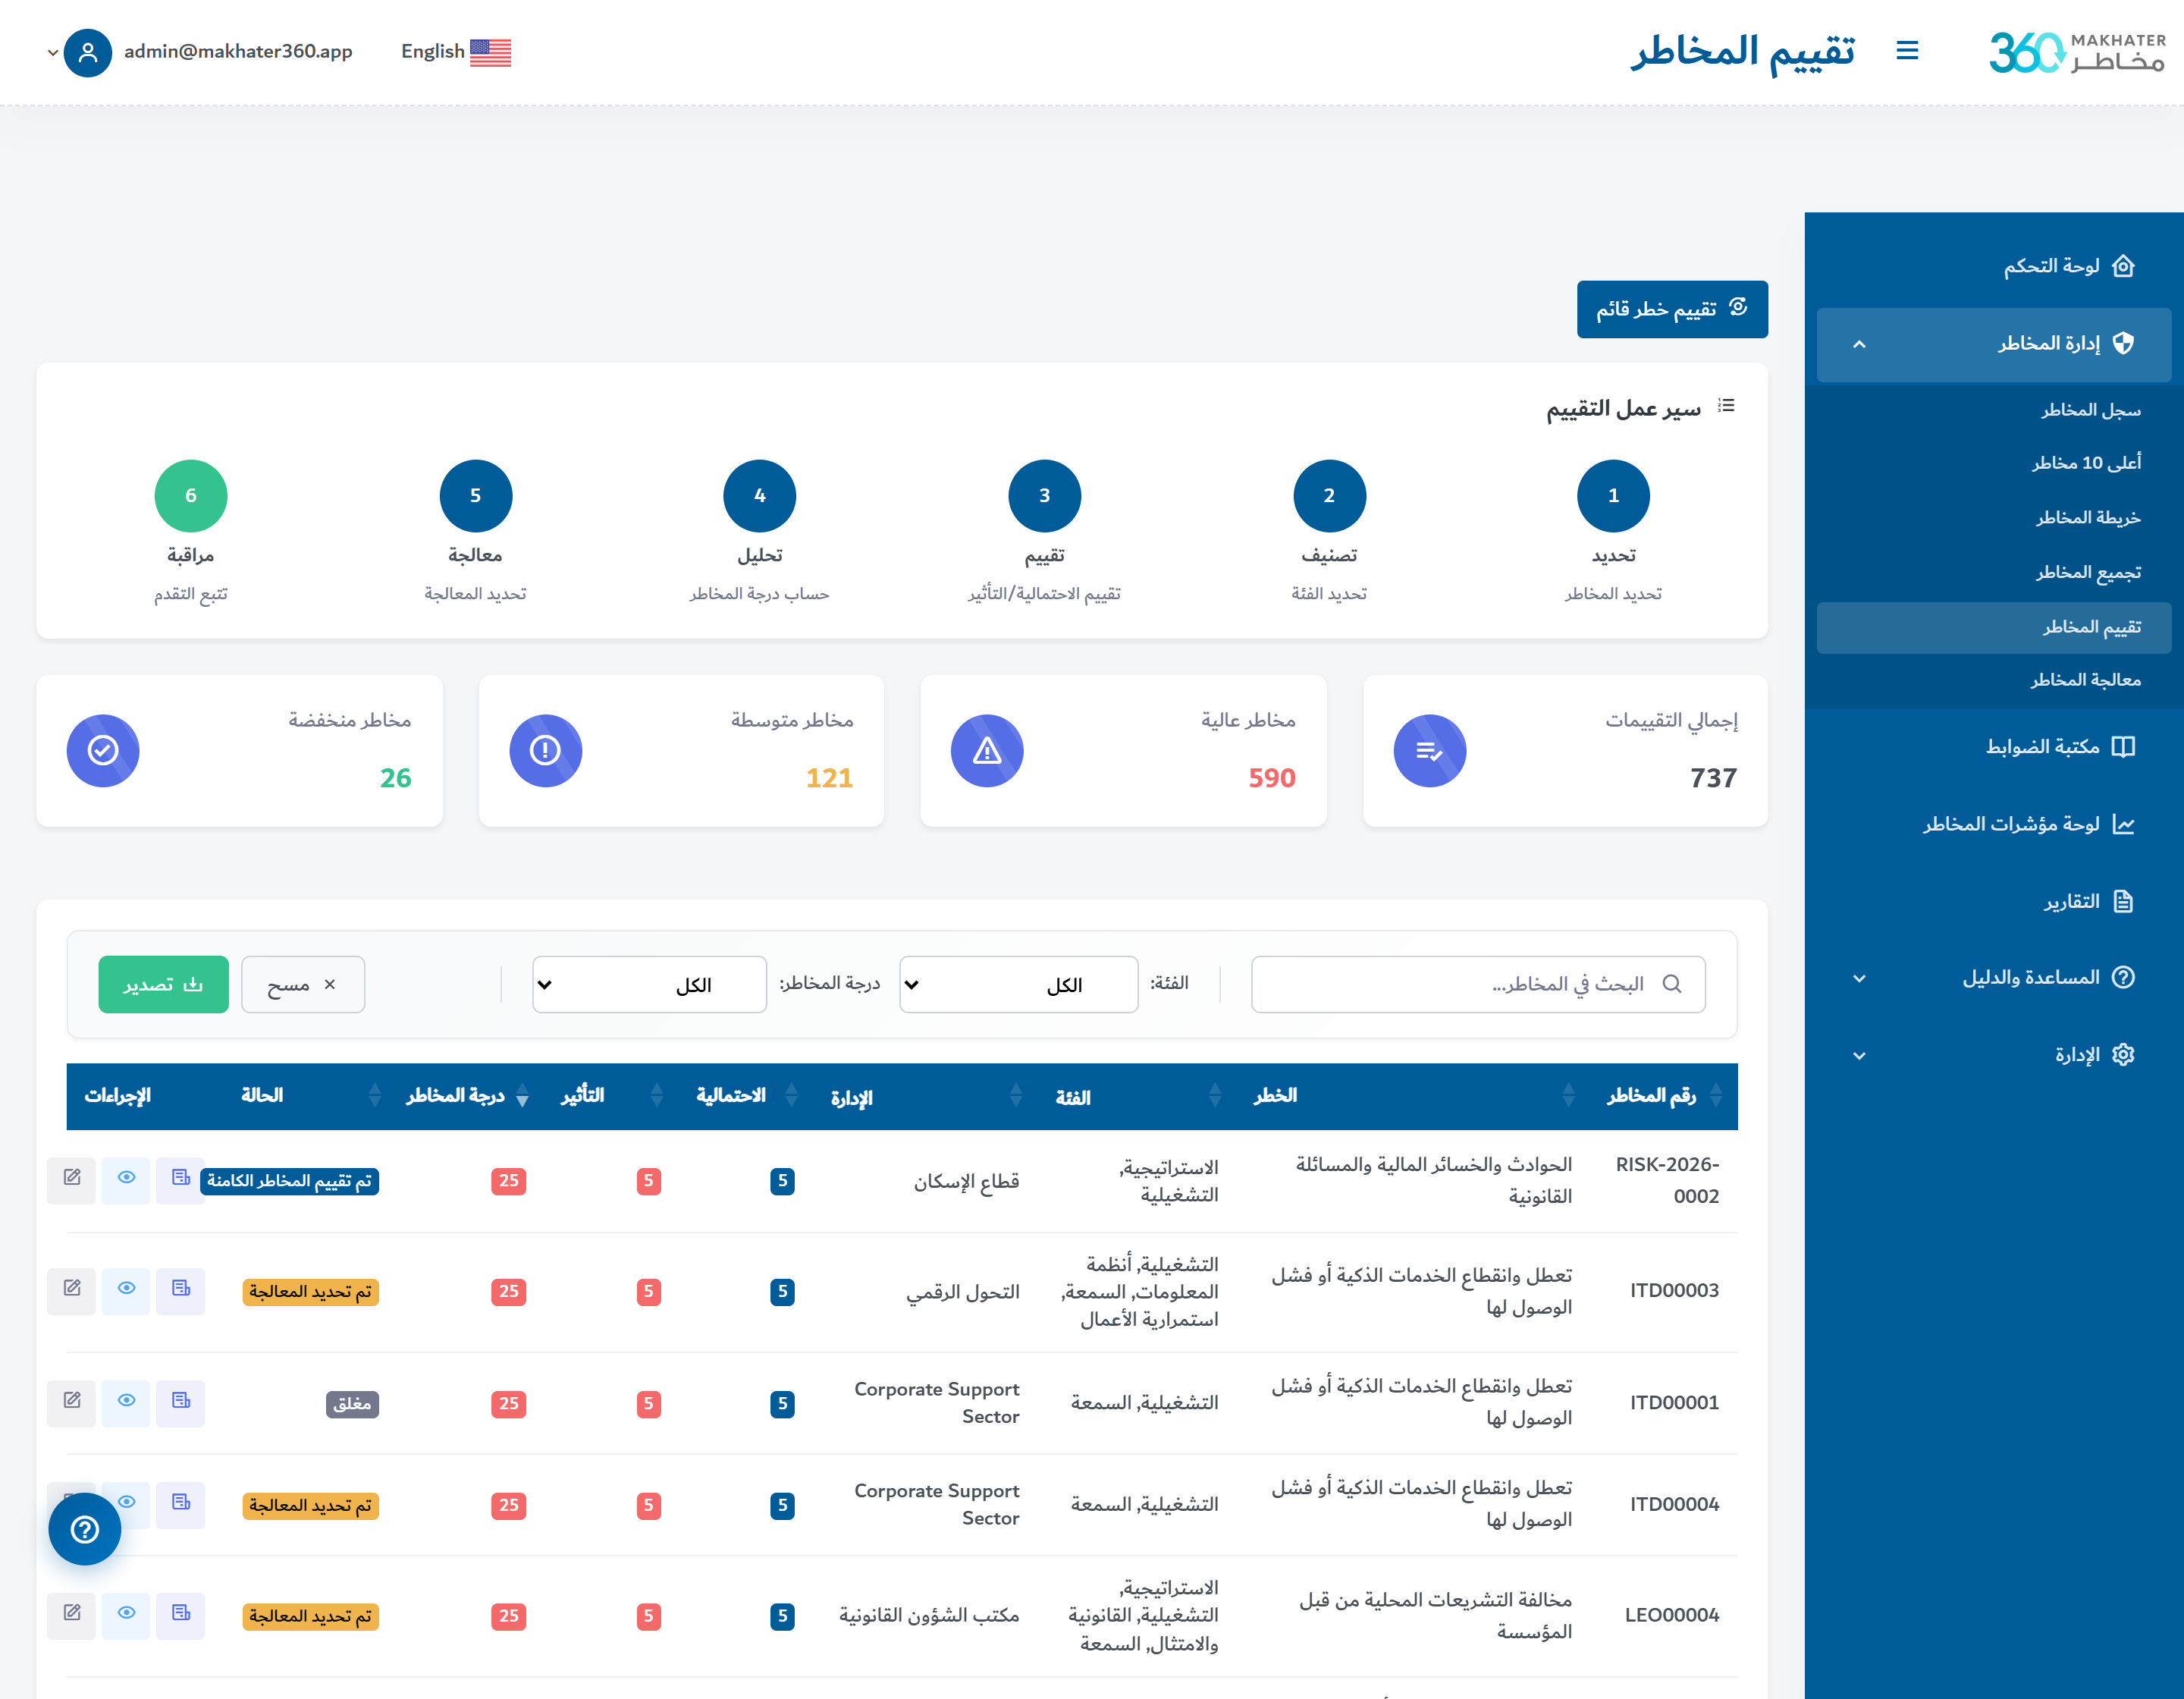
Score every risk on a 5×5 Likelihood × Impact matrix — inherent first, then residual after controls. Built-in assessment workflow (draft → review → approved → closed) with reviewer queues, remarks and a full audit trail of every scoring change.
Heat Map
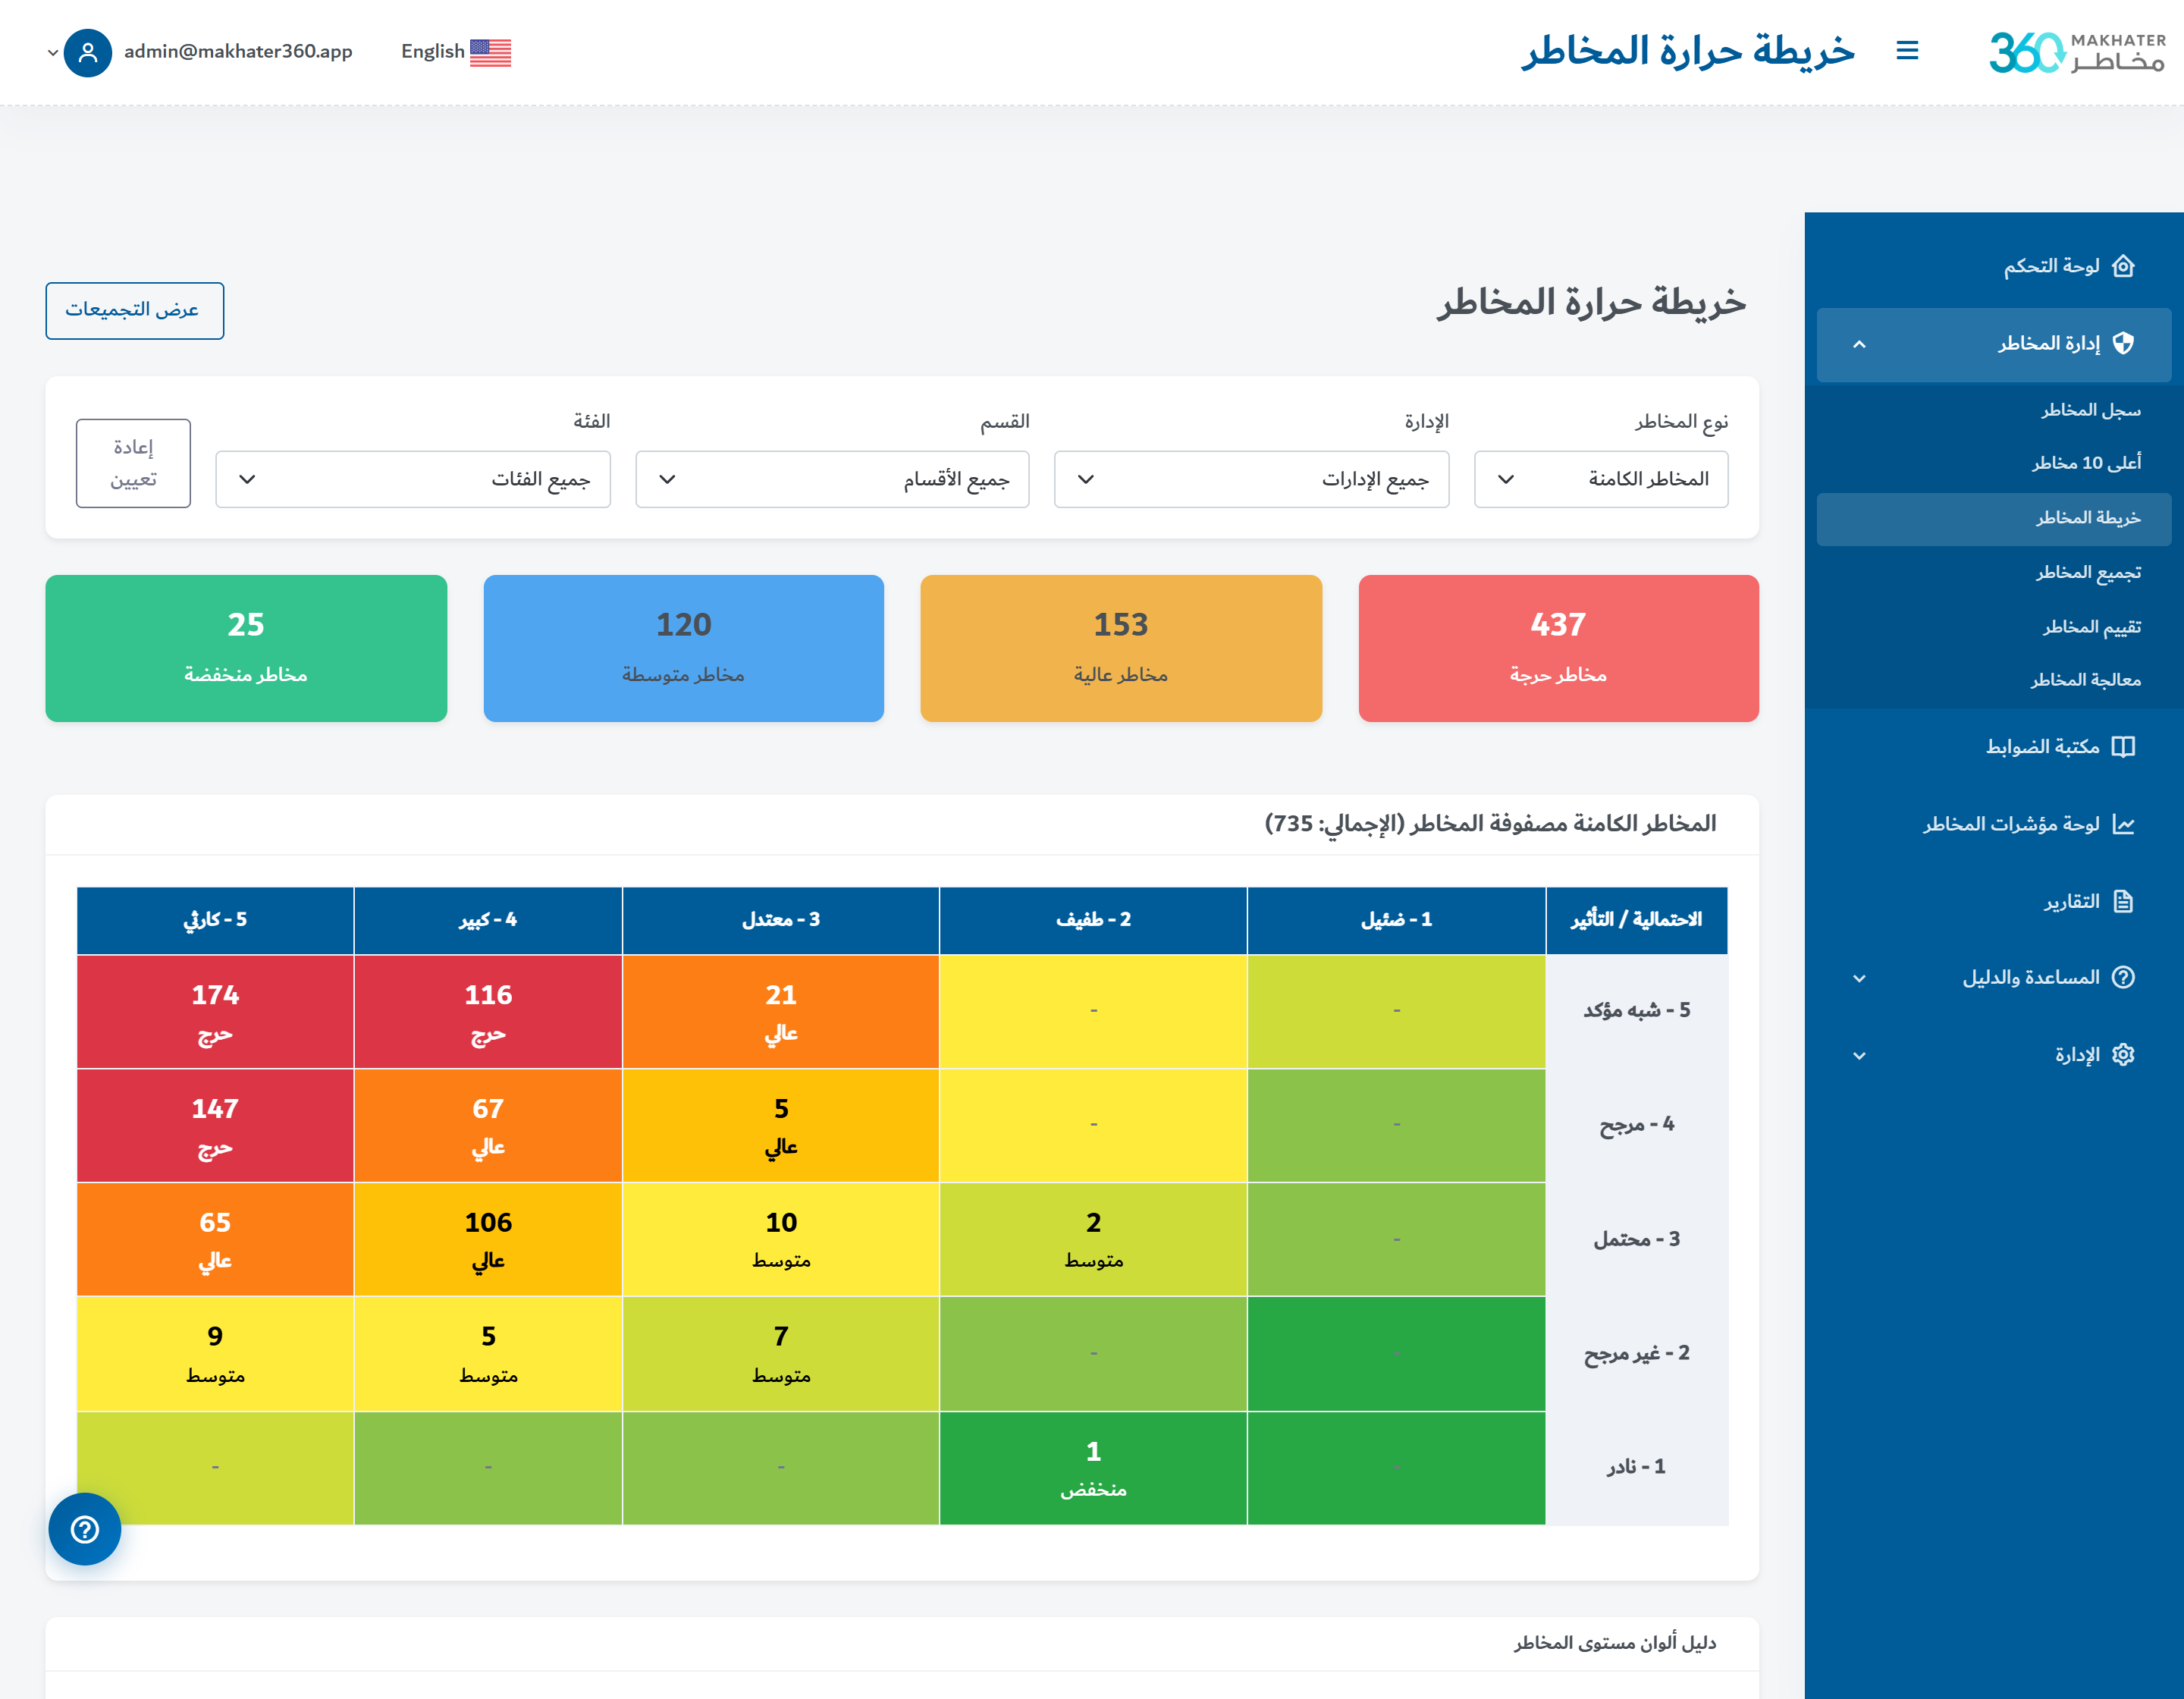
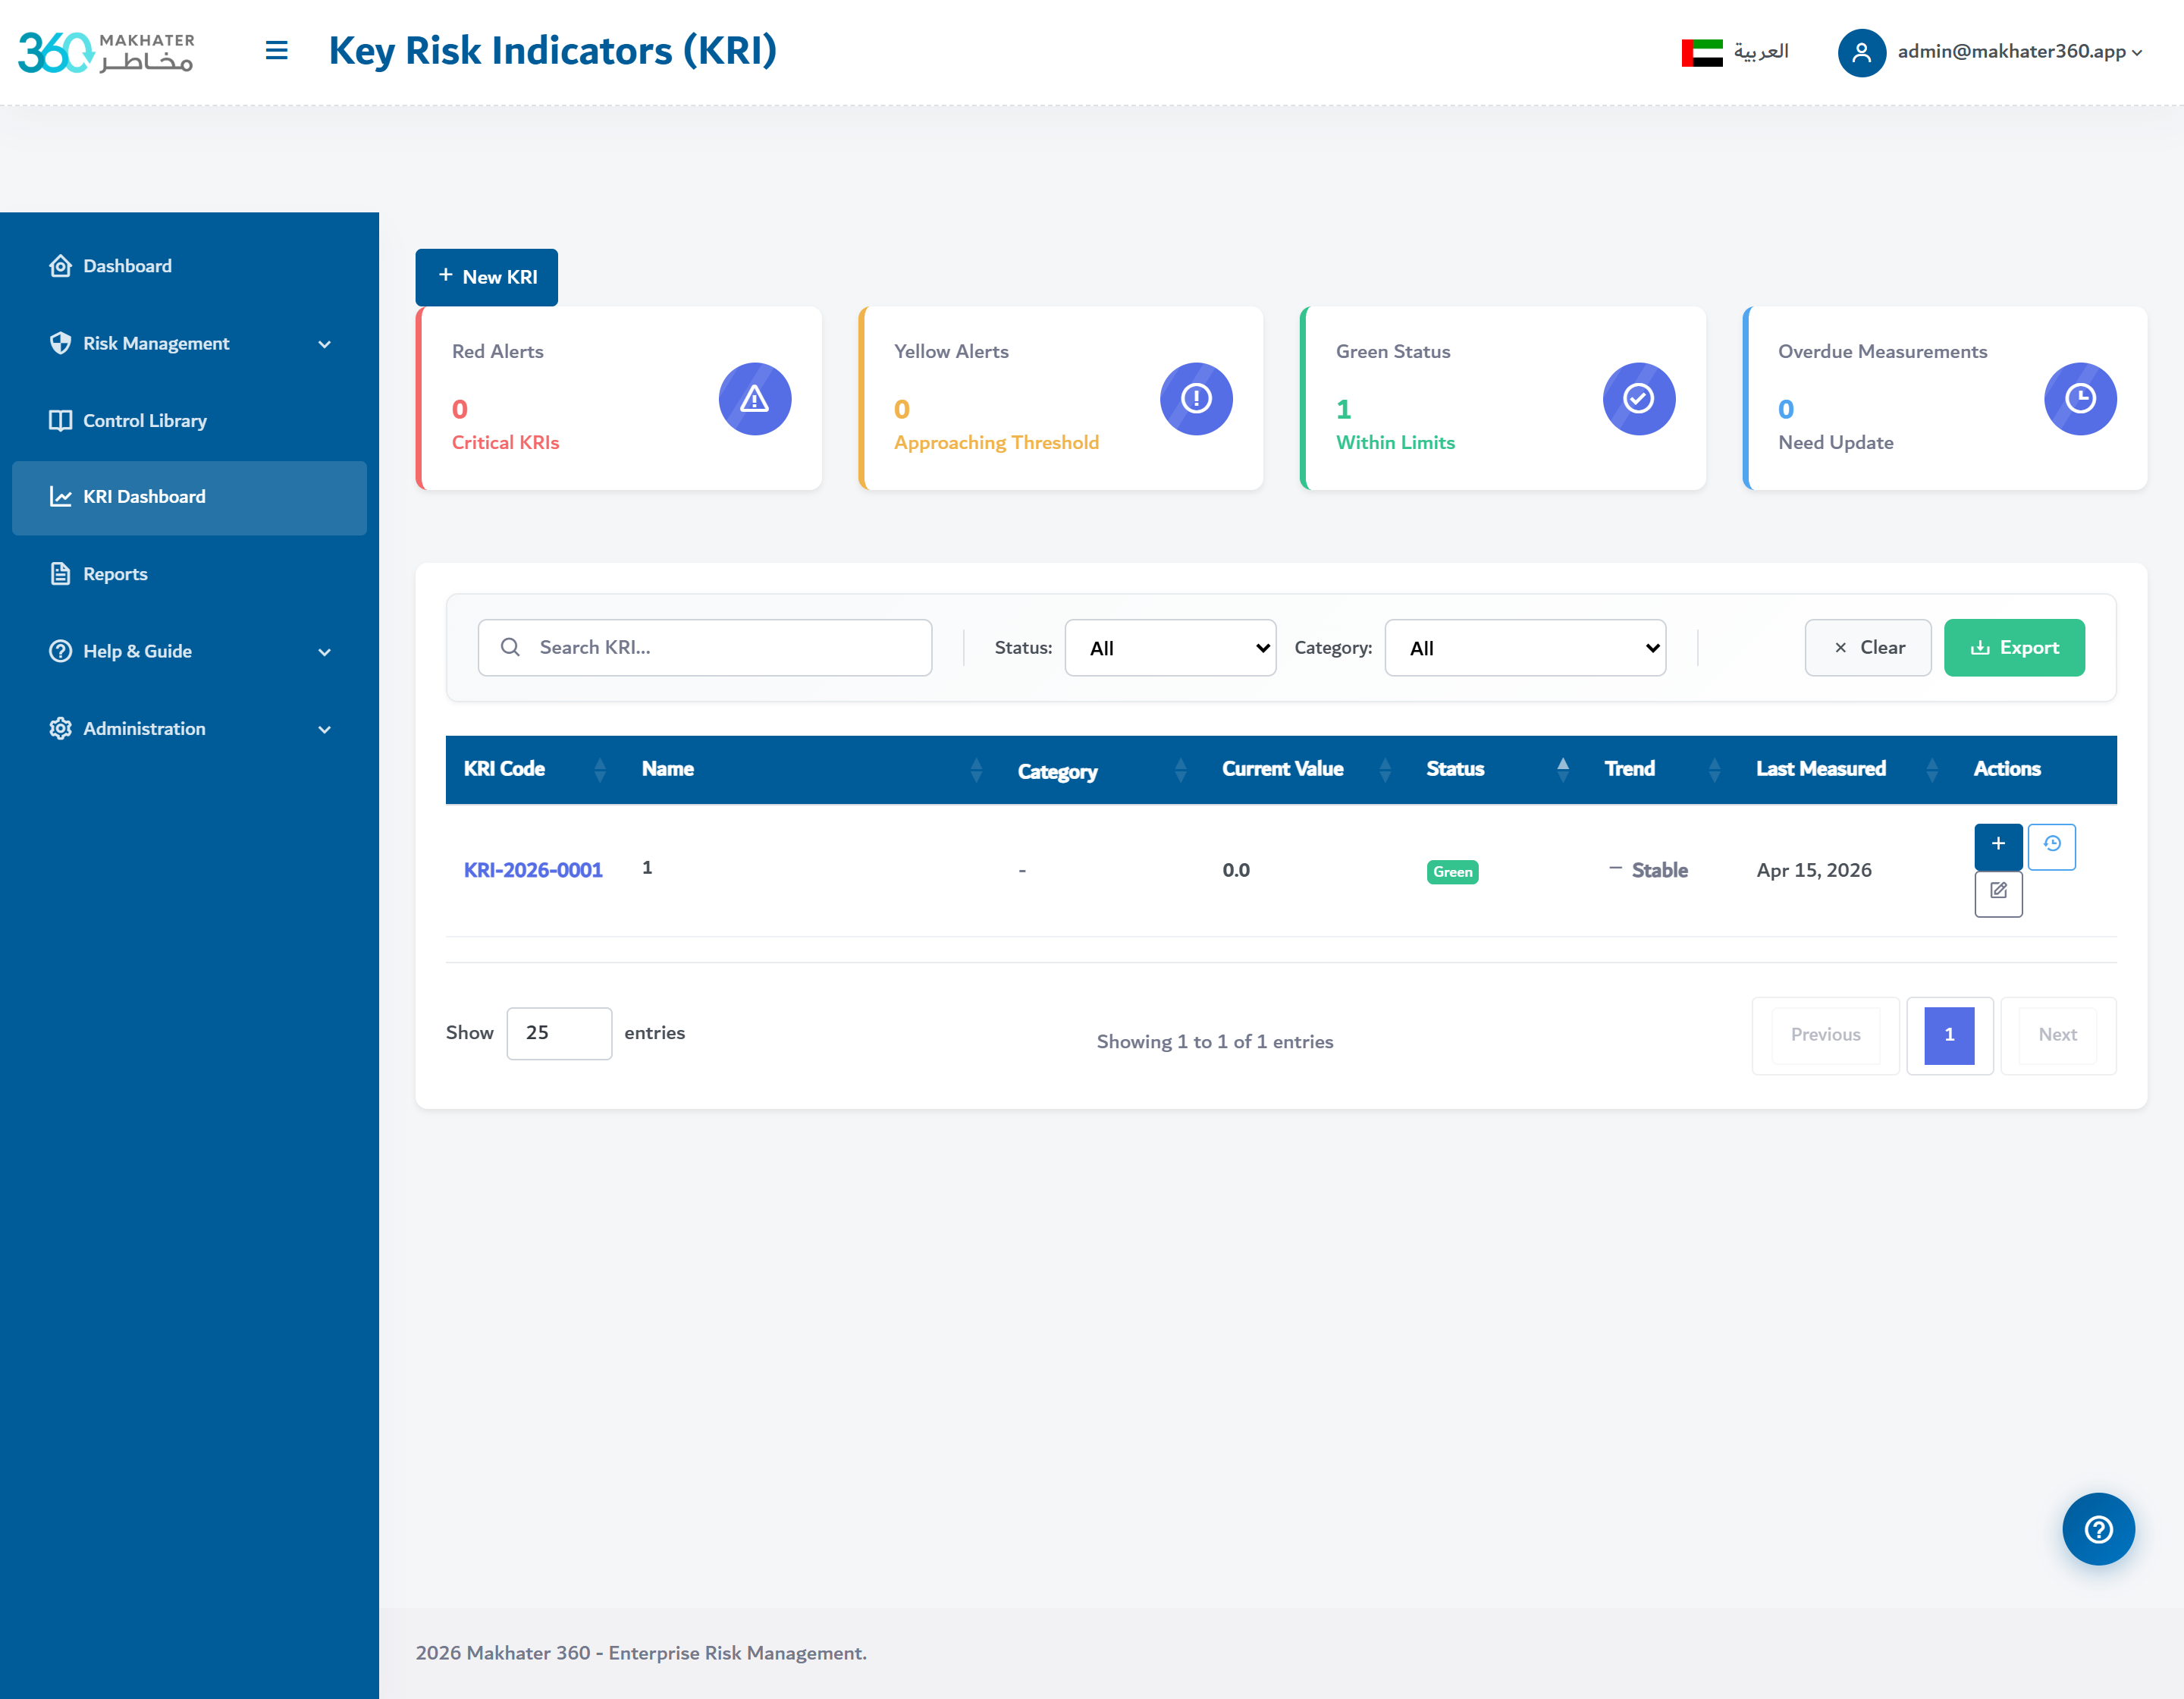
Plot every risk on a live 5×5 Likelihood × Impact matrix — inherent or residual view — with drill-down to the risks behind any cell. Aggregate by department, category or strategic objective to see exactly where exposure sits.
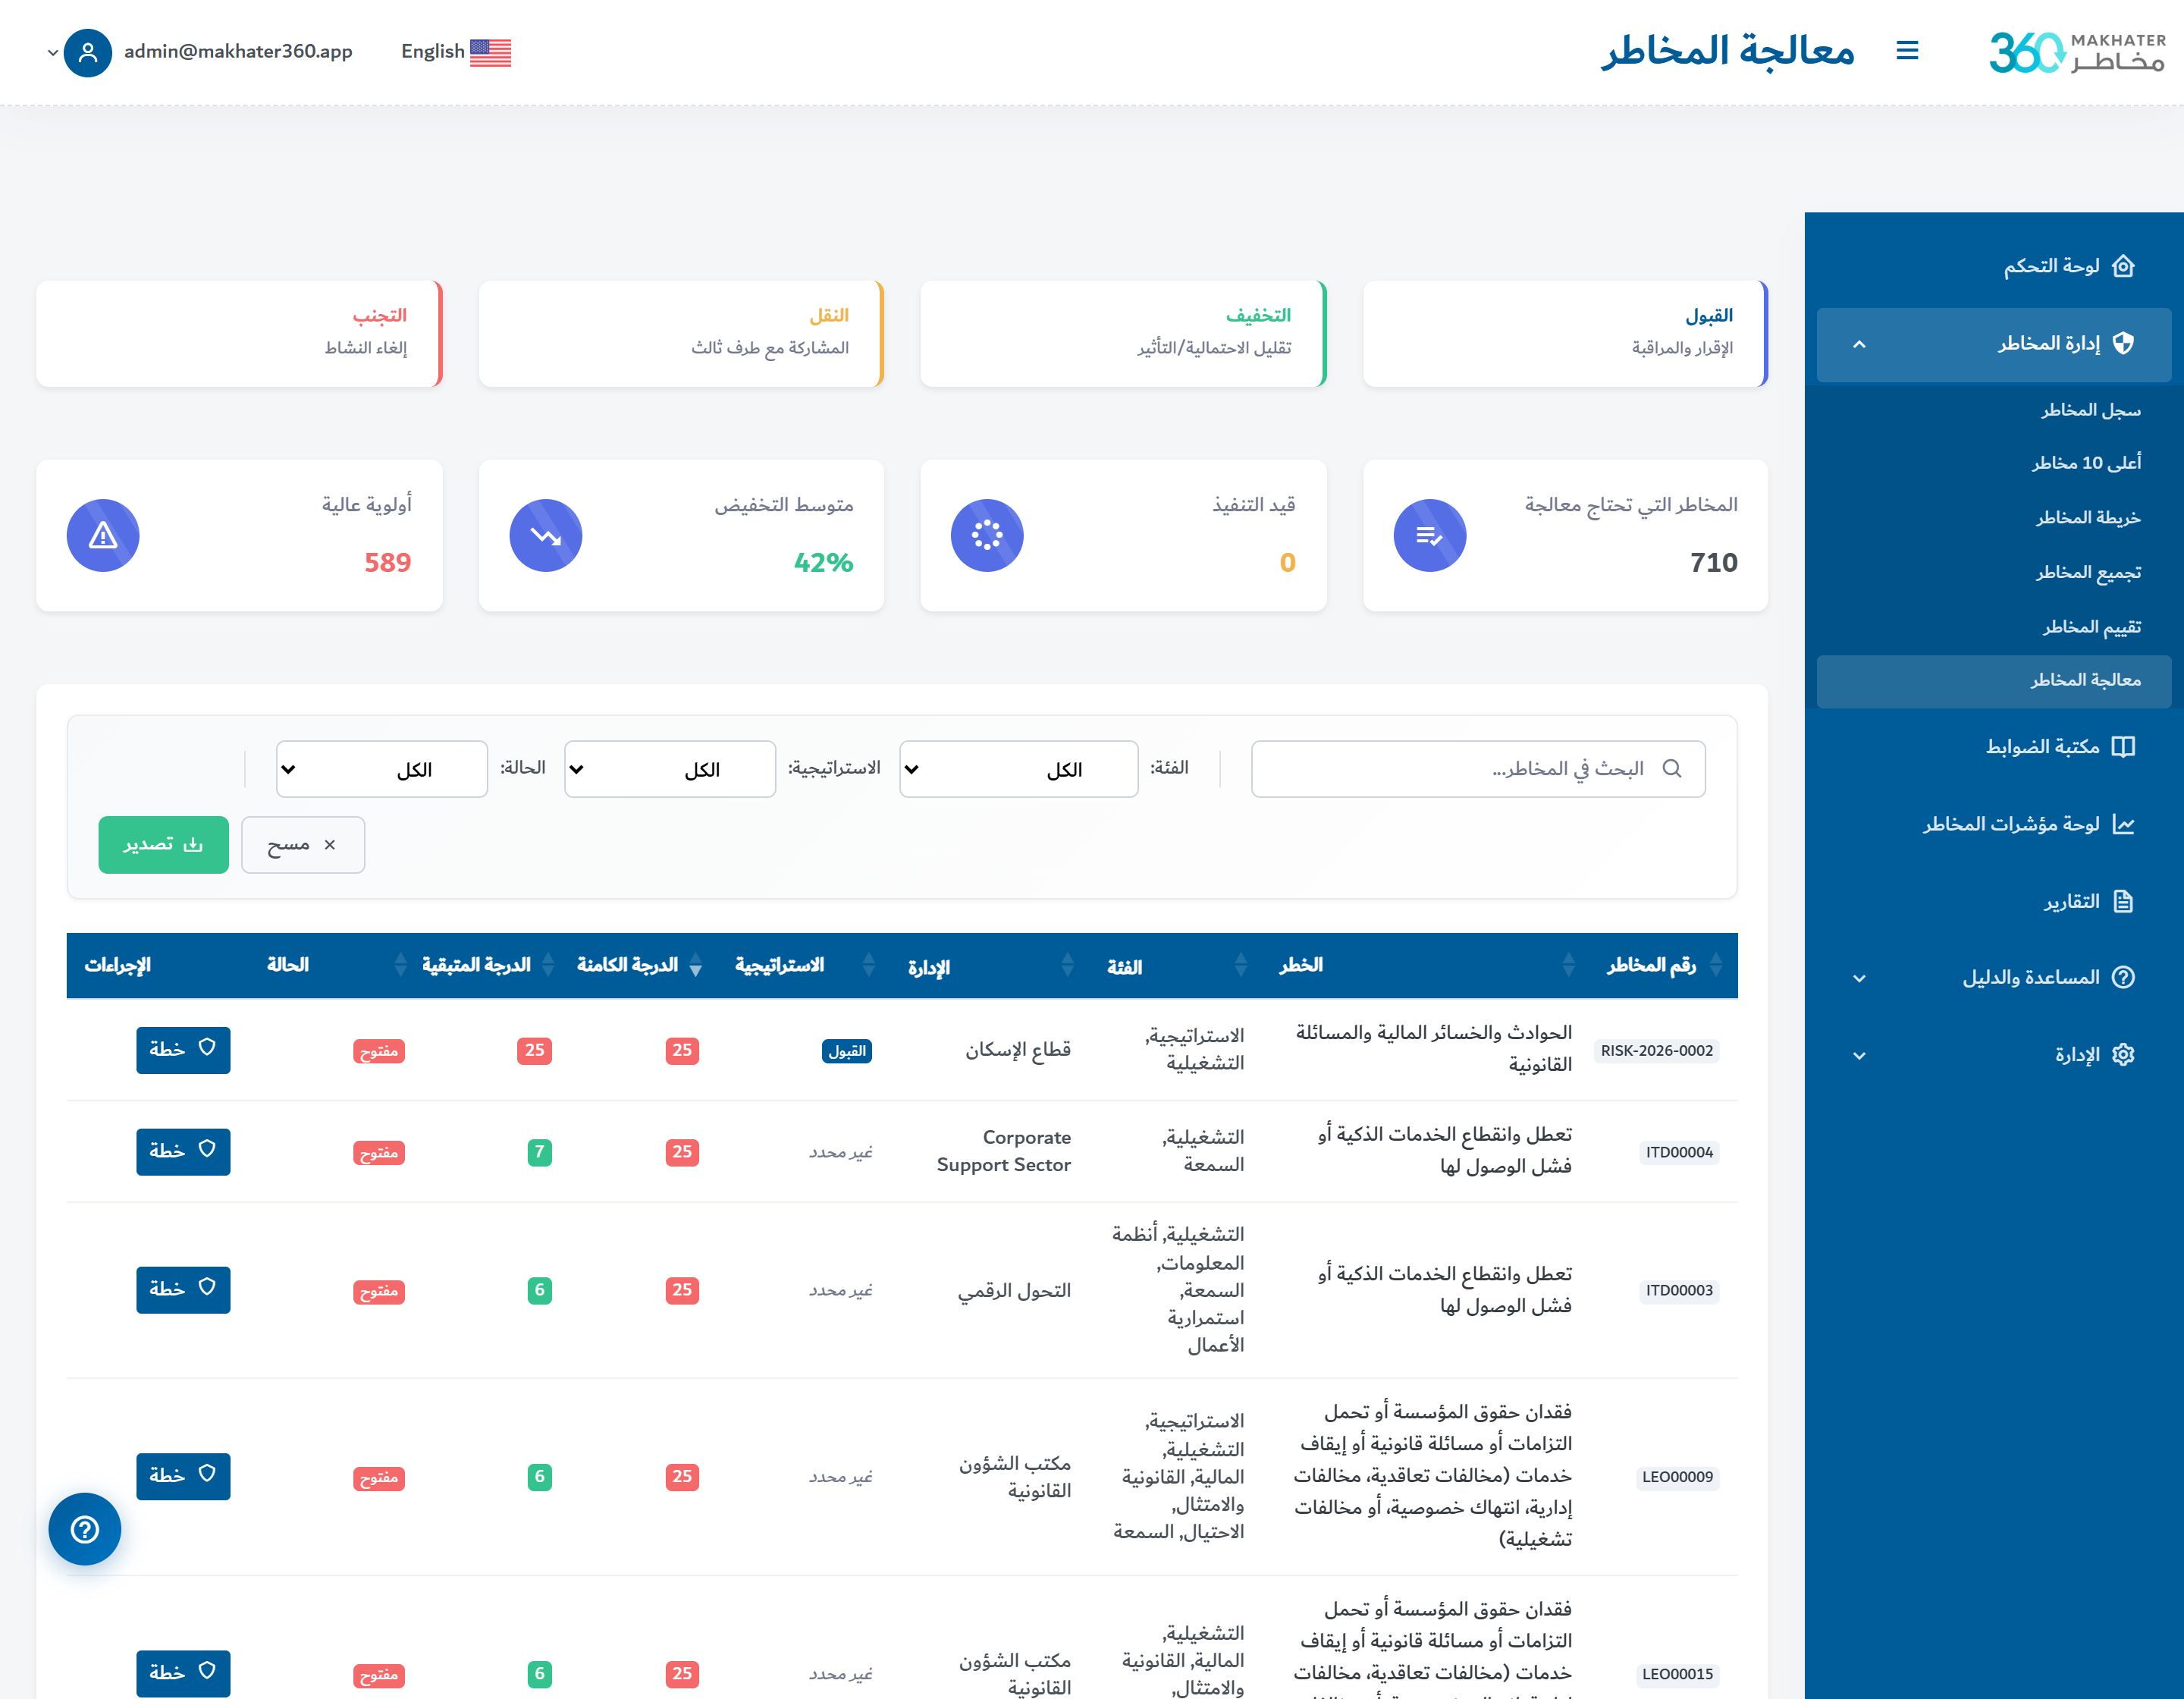
Risk Treatment
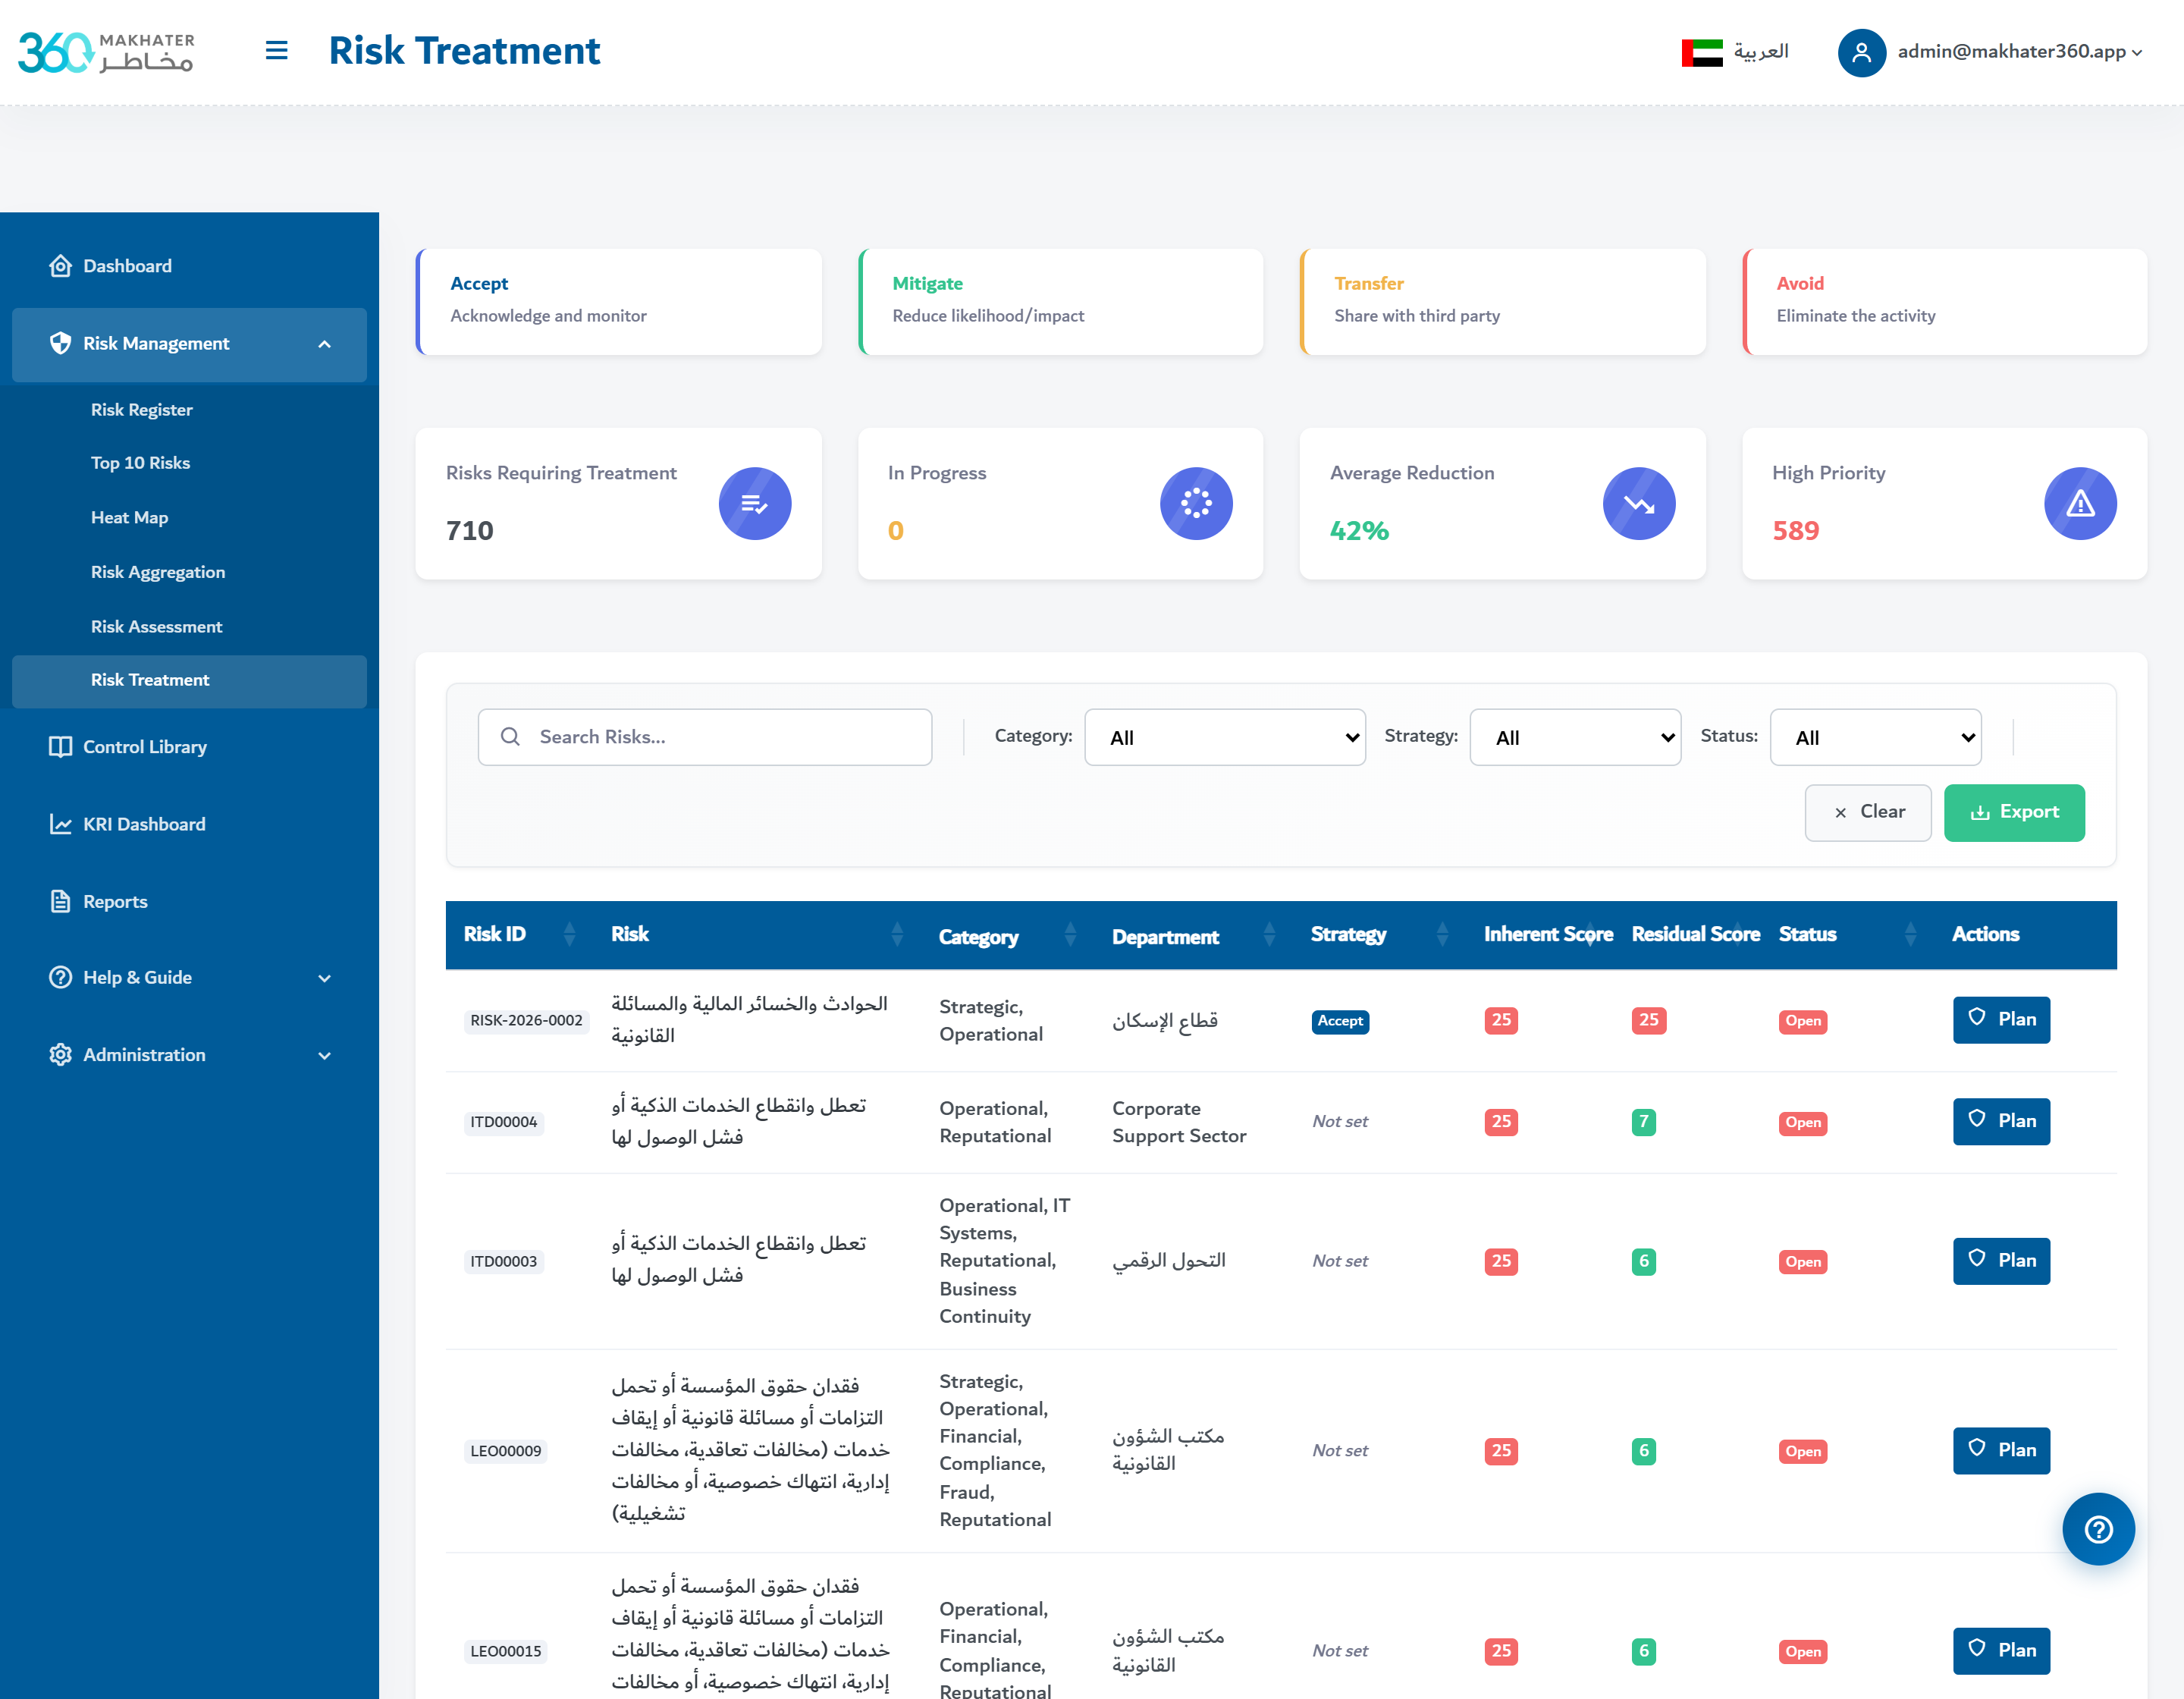
Pick the right strategy for every risk — Mitigate, Transfer, Avoid or Accept — each with an owner, target date, budget and expected residual score. Track action completion, link to controls, and record evidence of effectiveness.
Controls Library
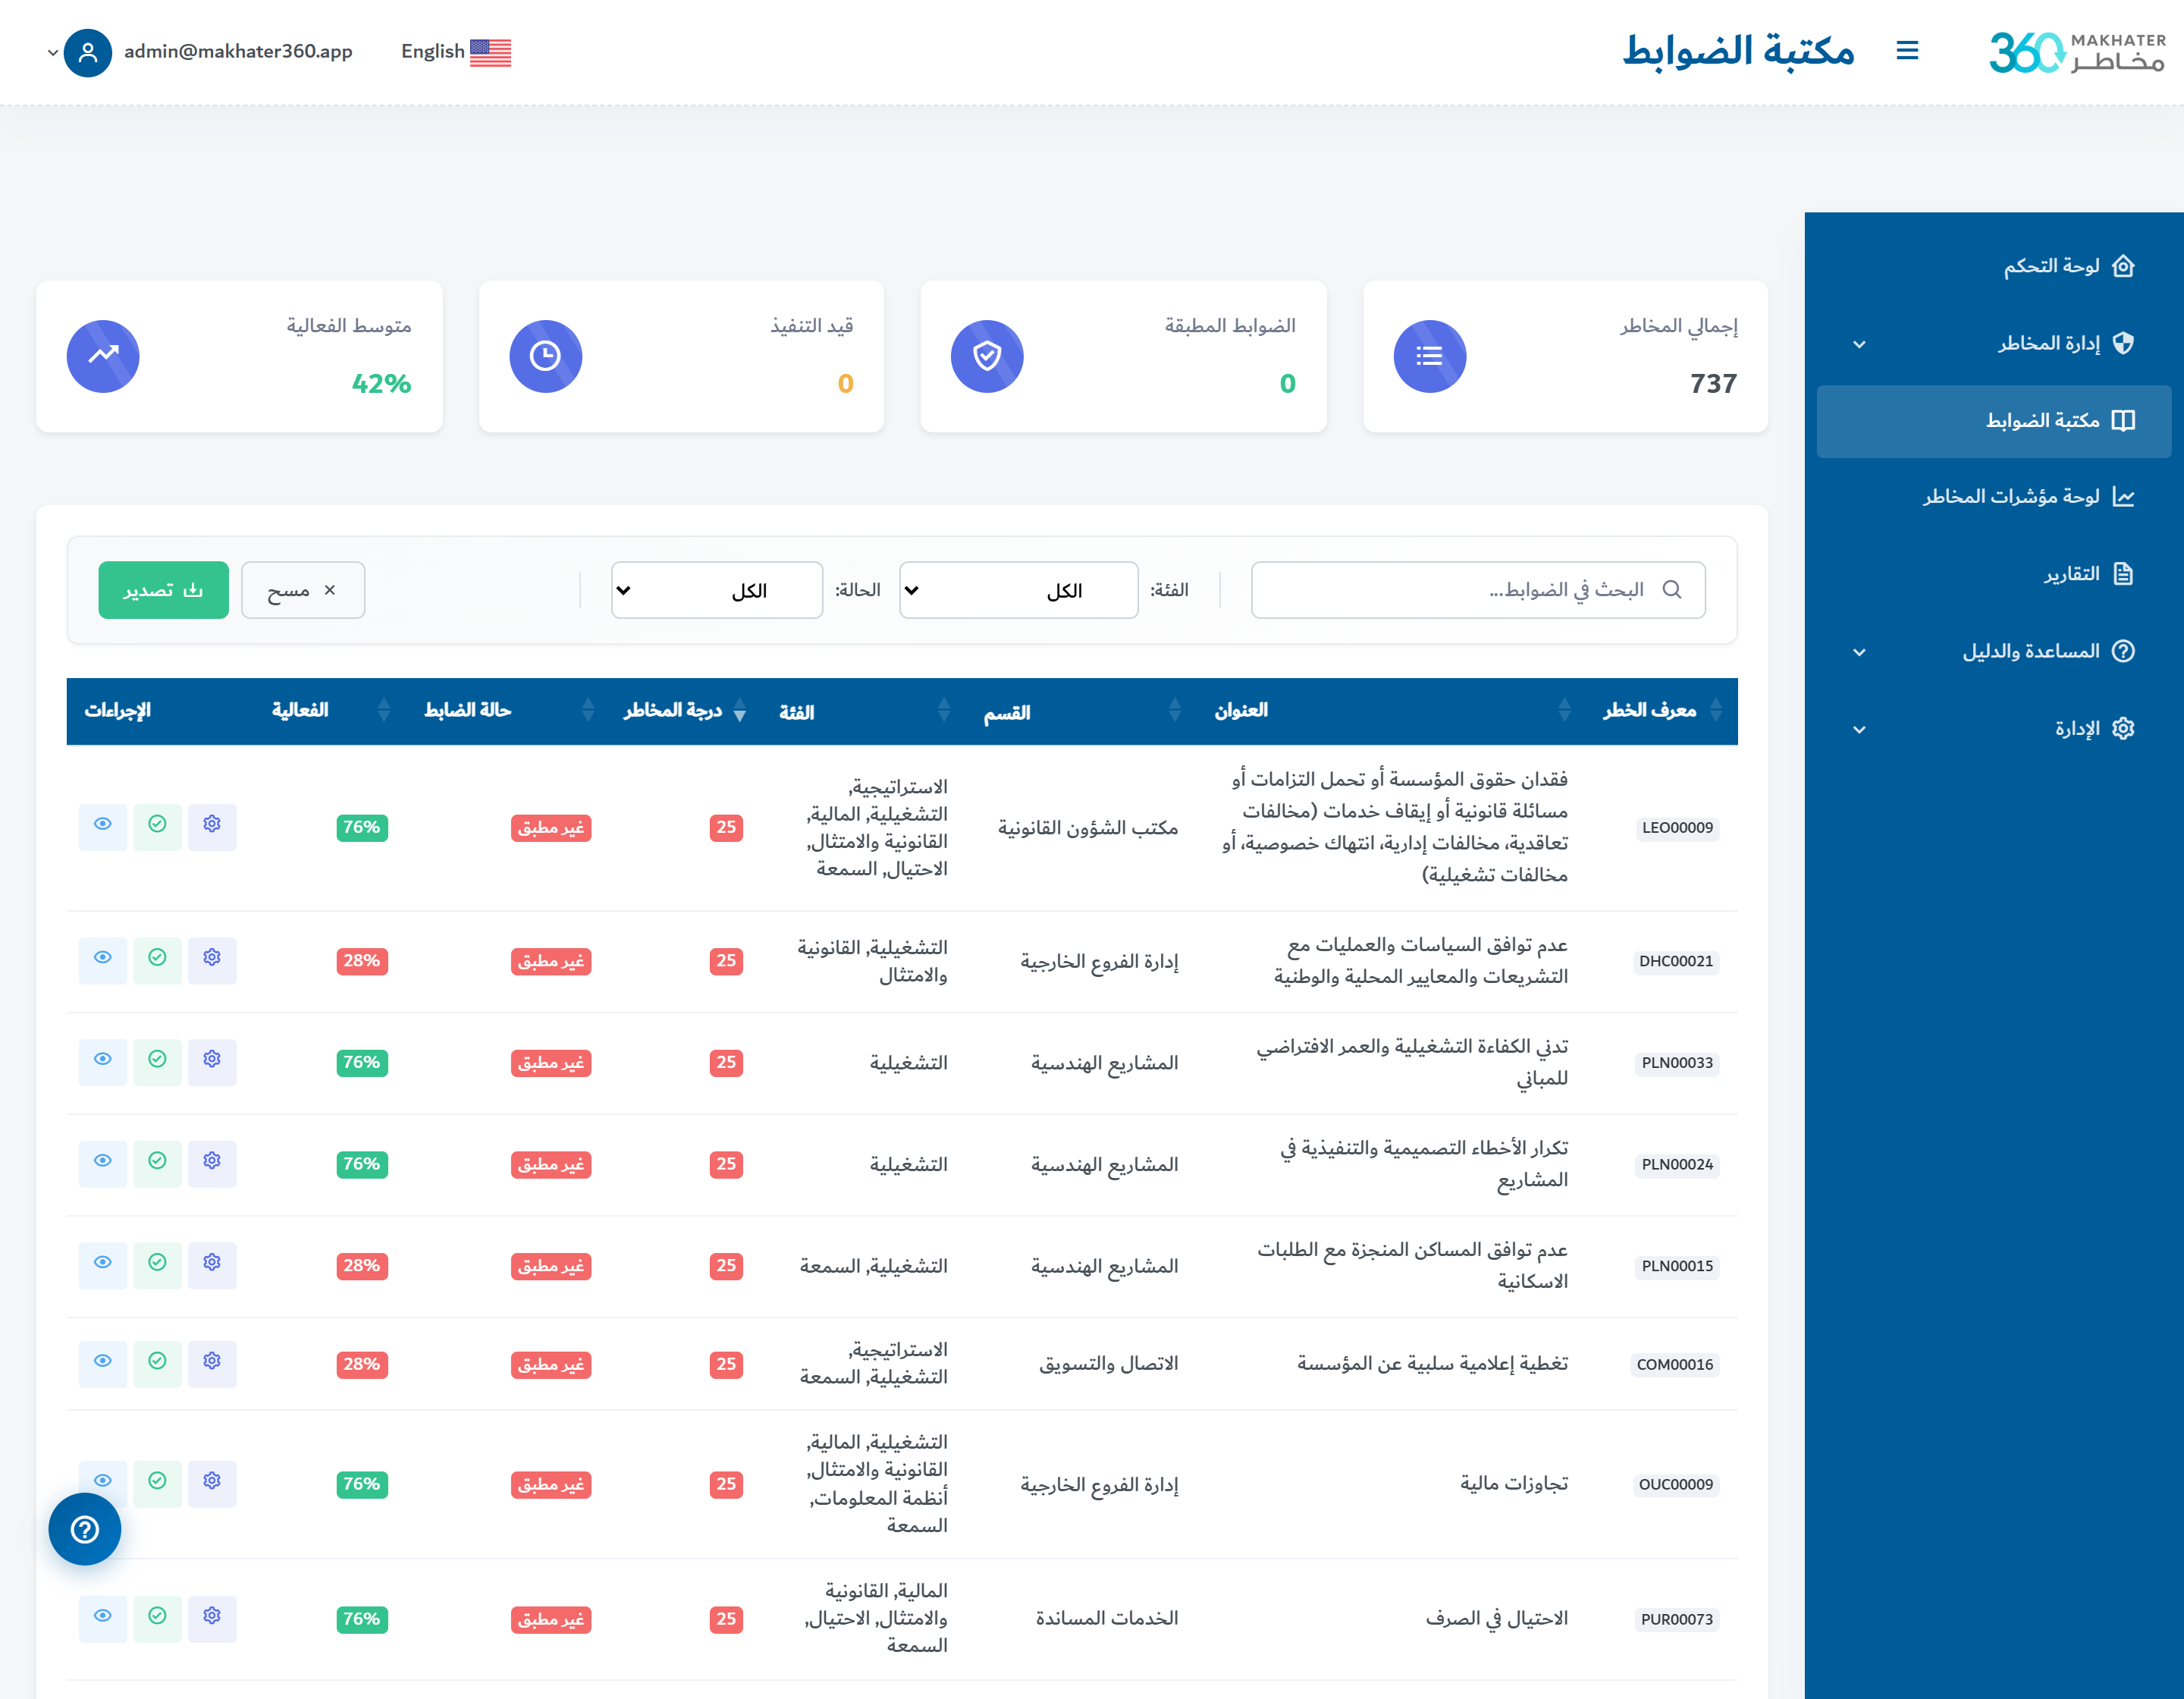
Maintain a living inventory of preventive, detective, and corrective controls. Each control is rated for design and operating effectiveness, tied to the risks it mitigates, and flagged when its adequacy falls below policy.
KRI Monitoring
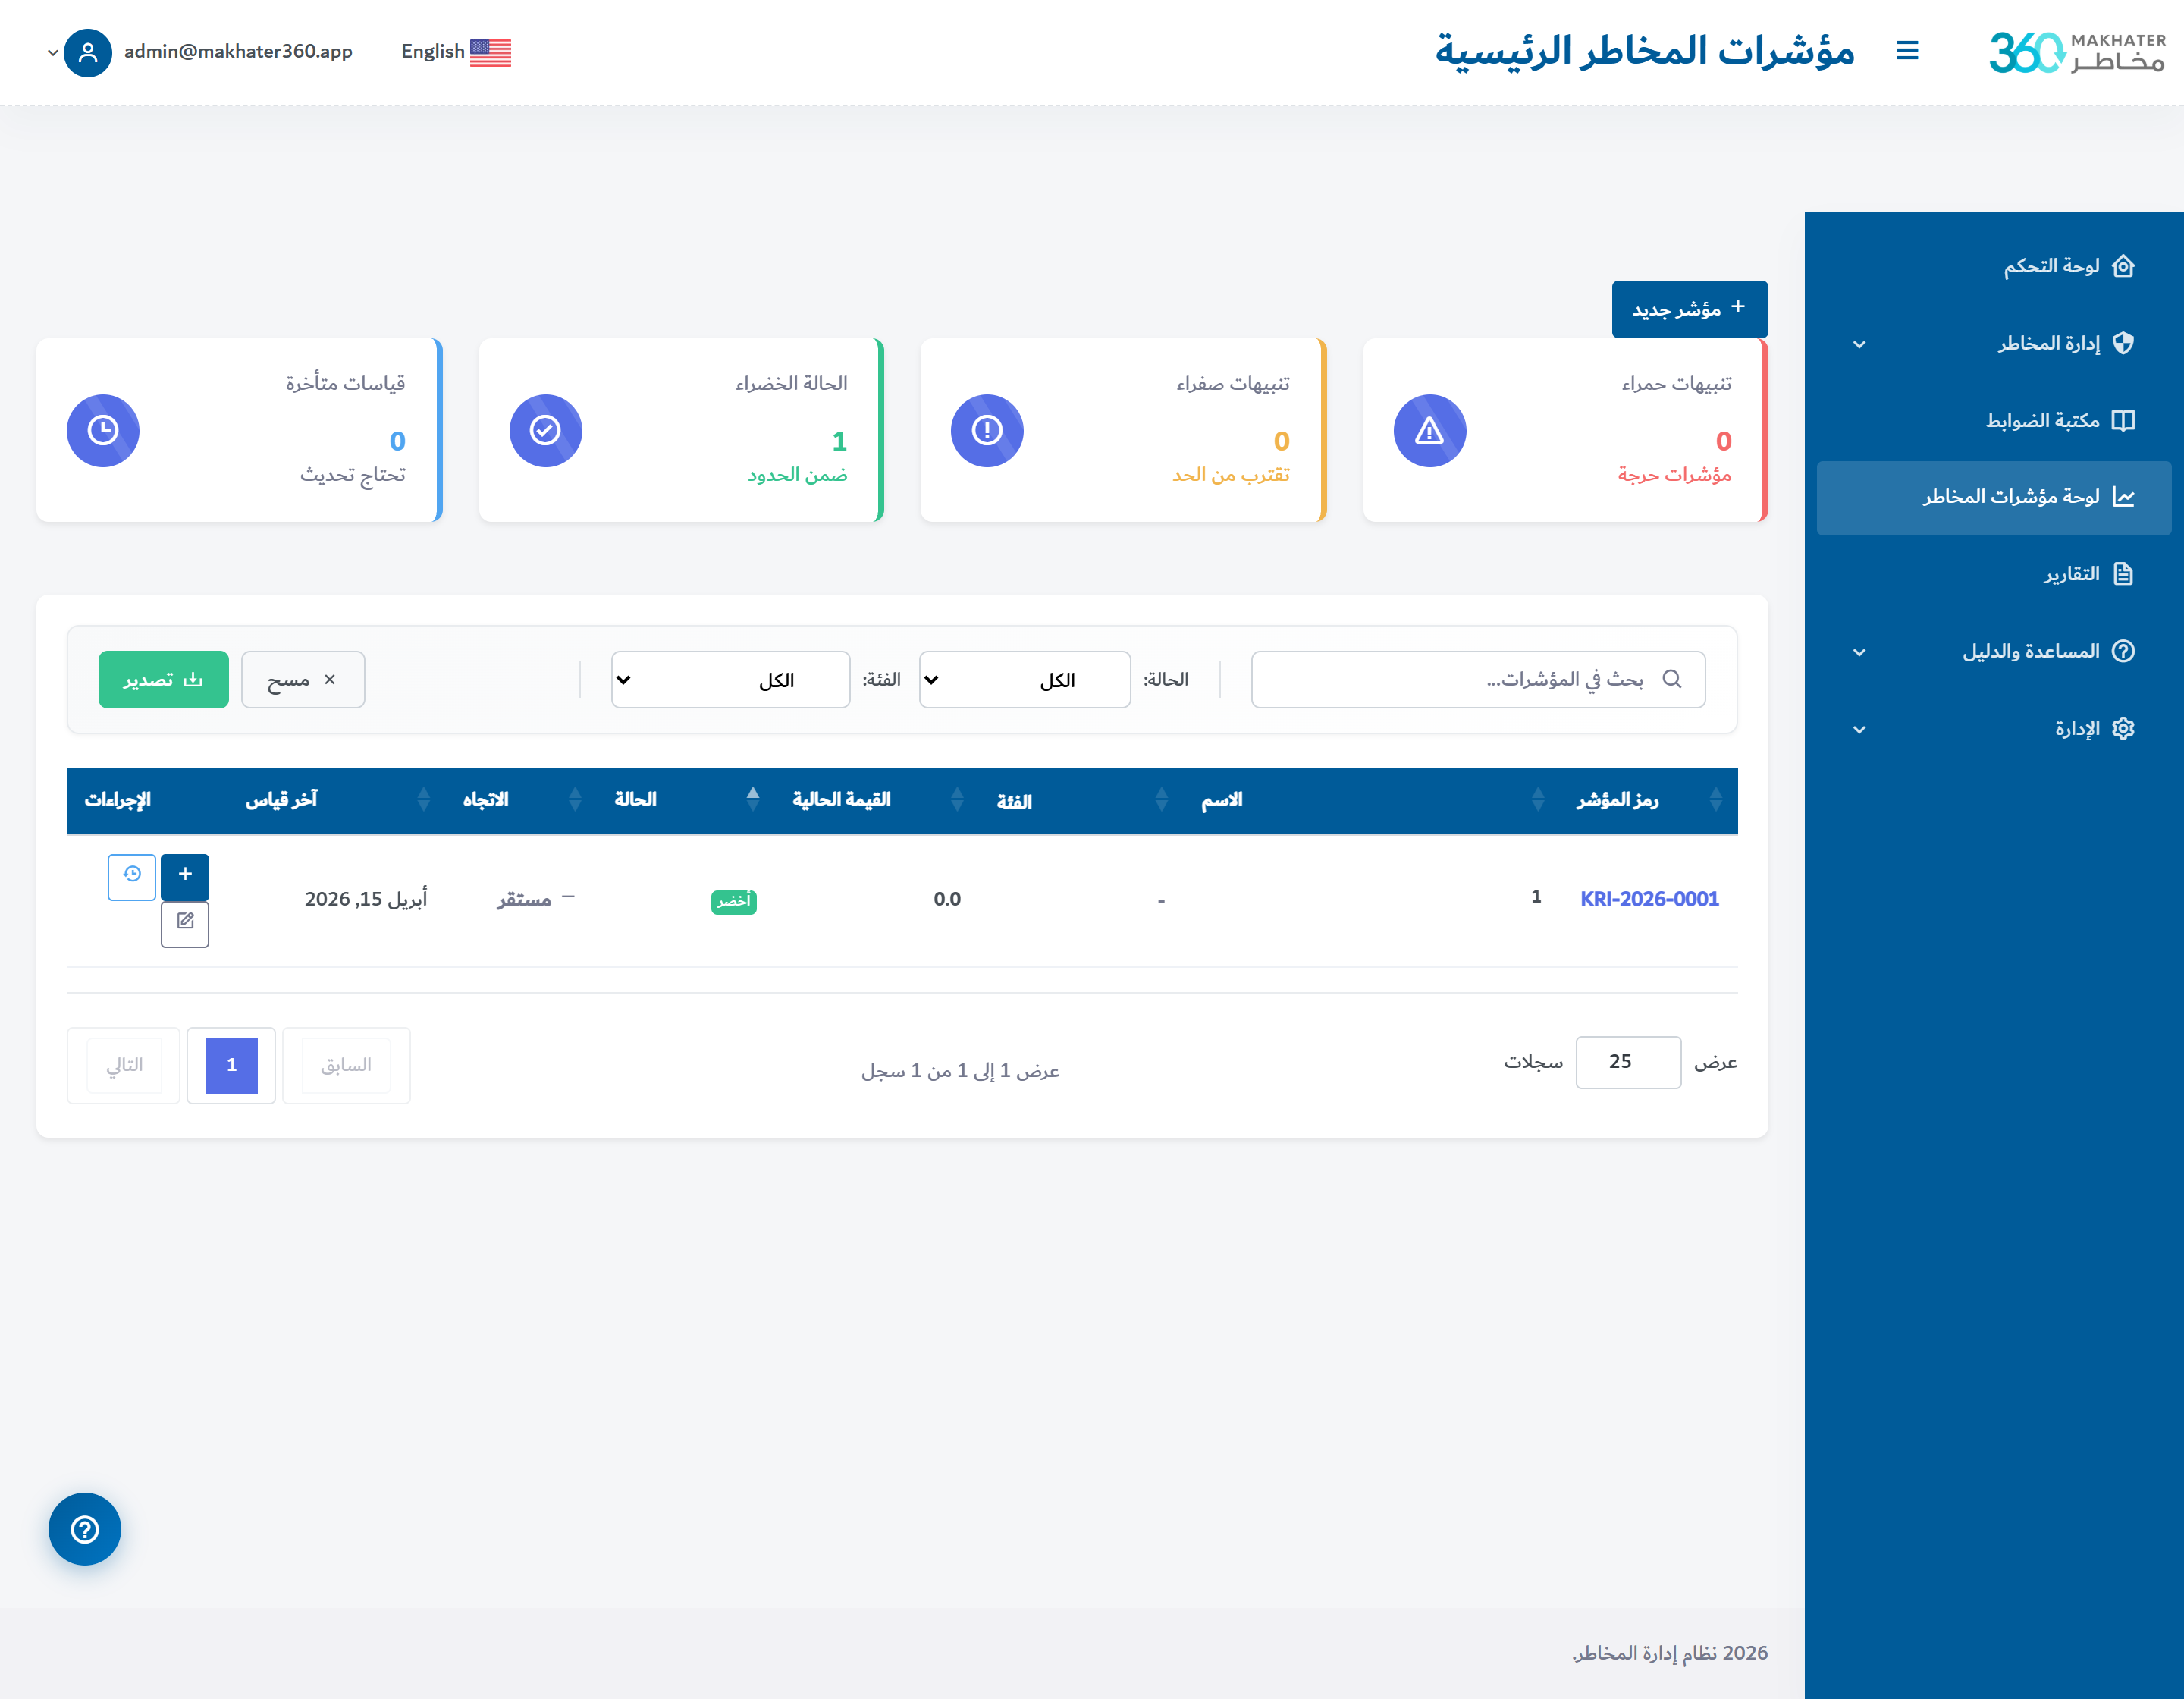
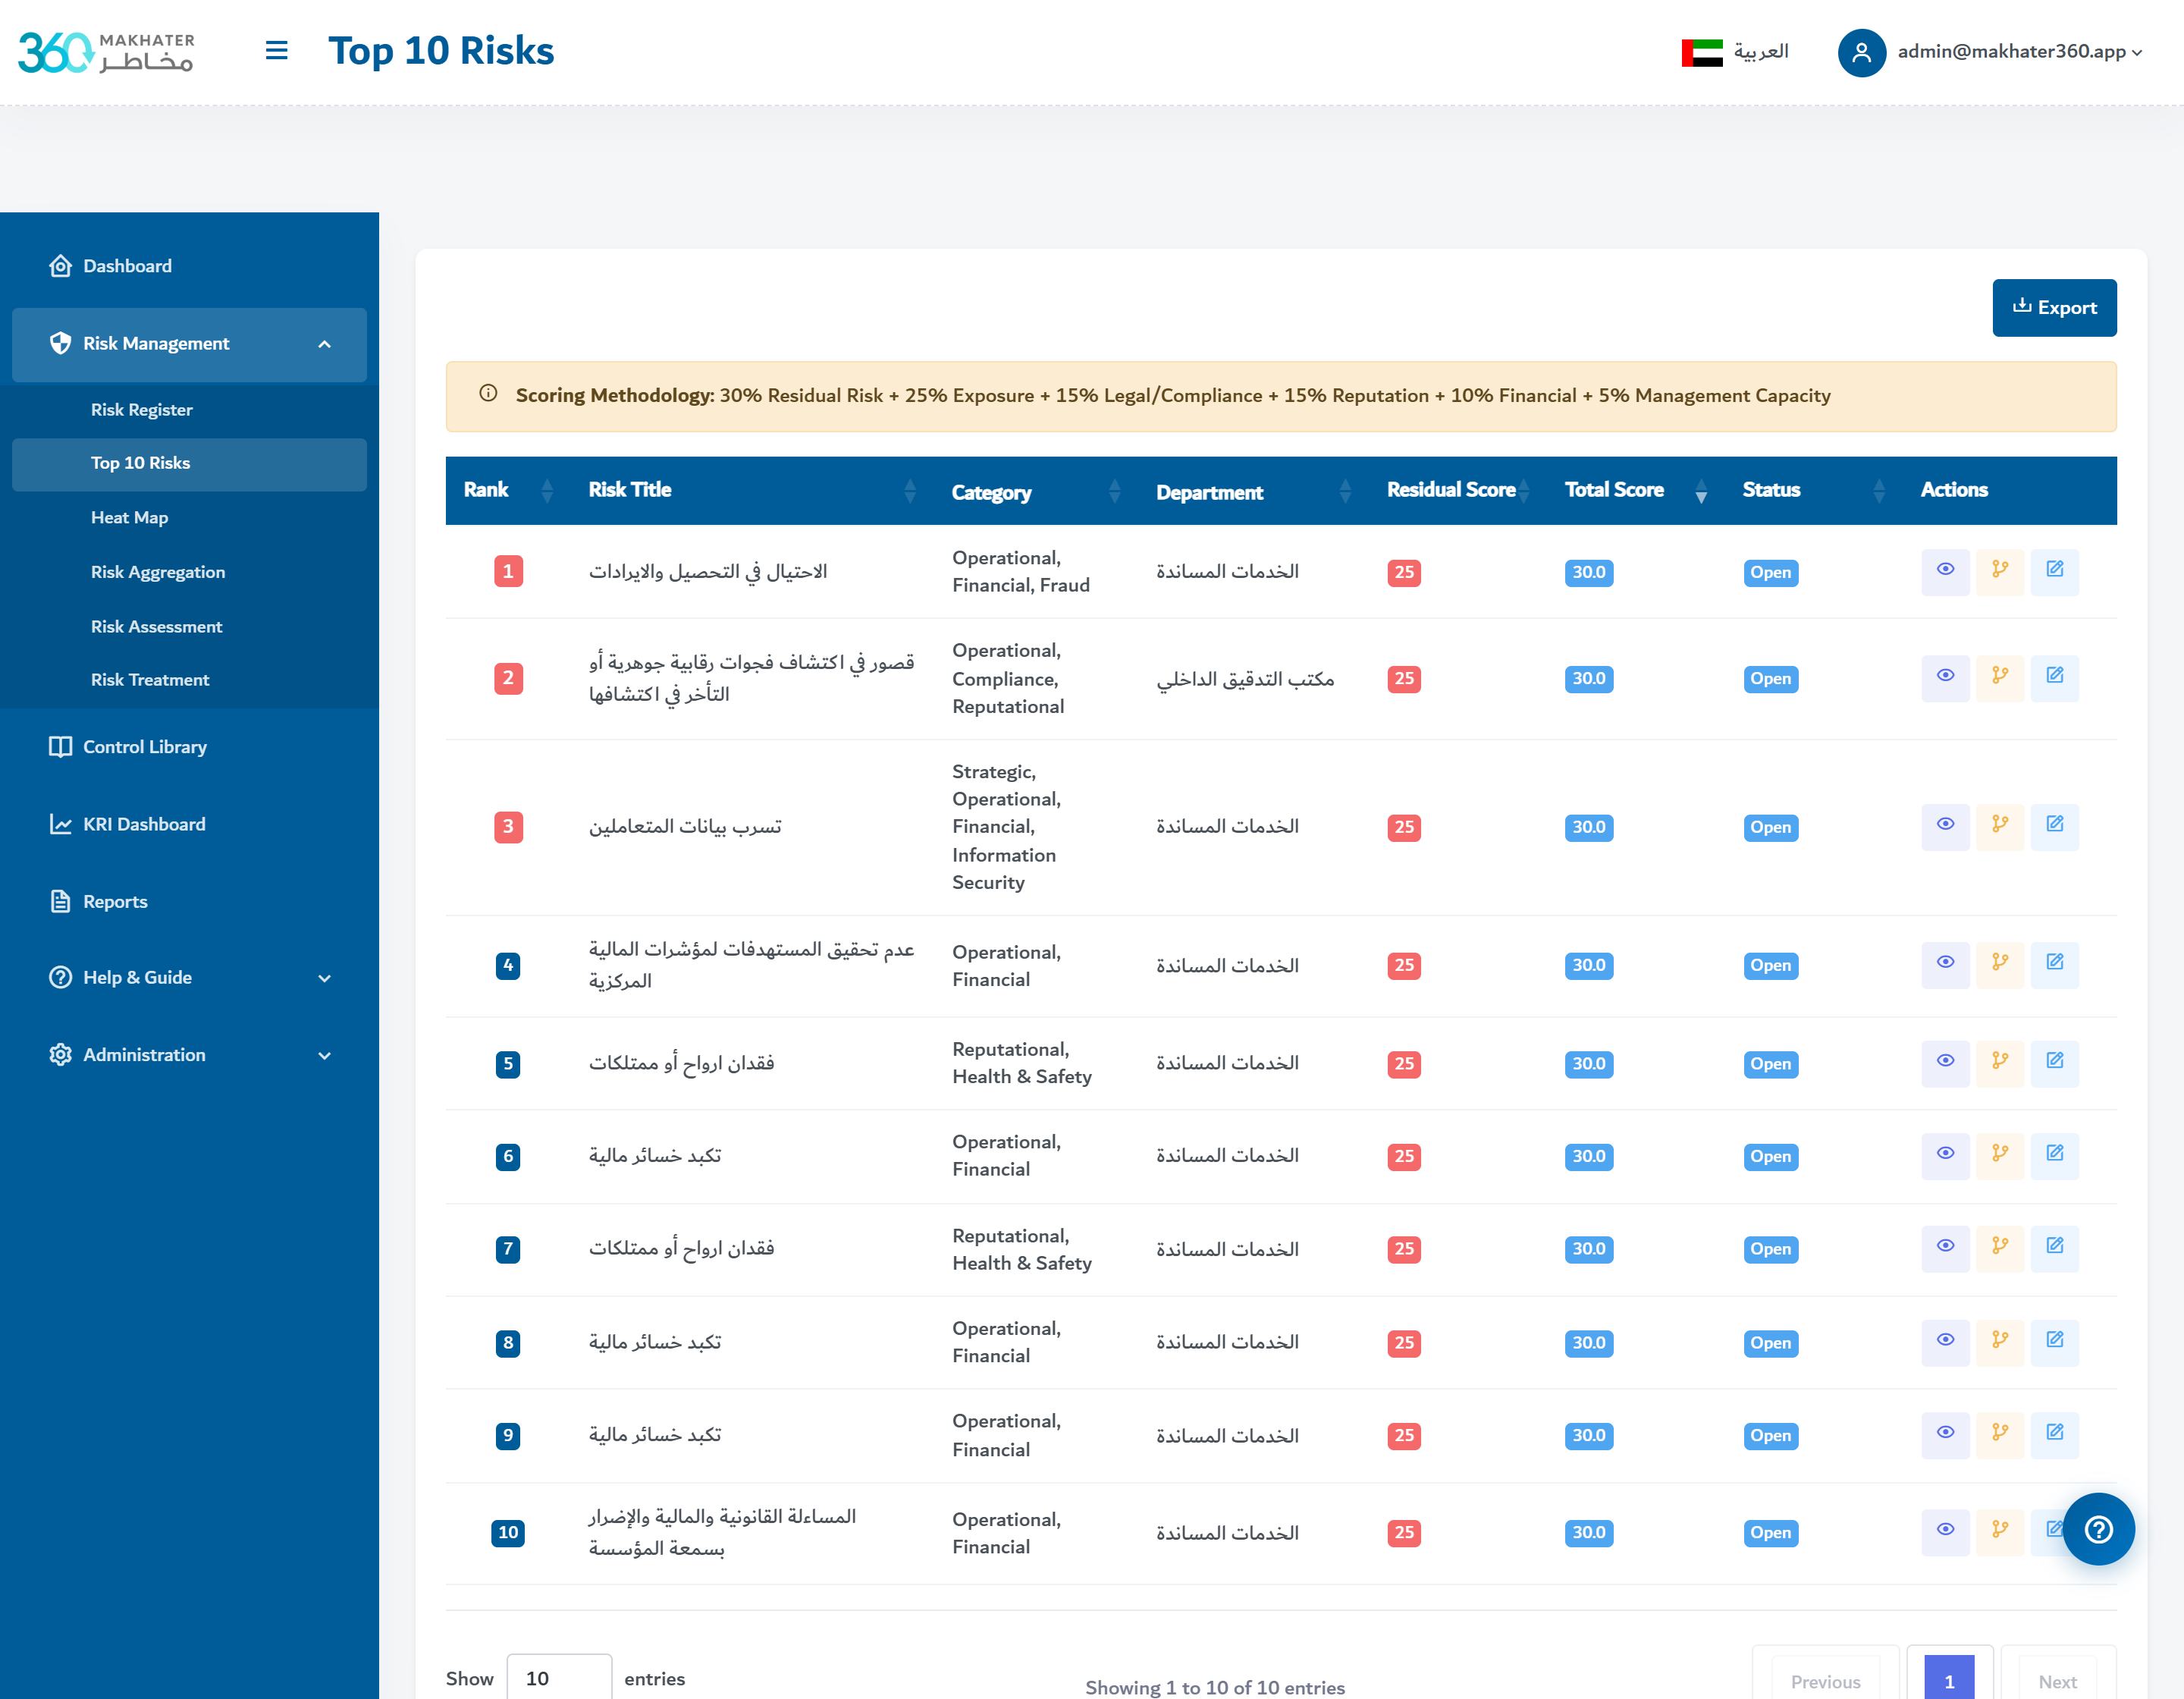
Define Key Risk Indicators with green / amber / red thresholds, refresh their values on a configured cadence, and alert owners the moment a threshold is breached. The early-warning layer that keeps risk from becoming surprise.
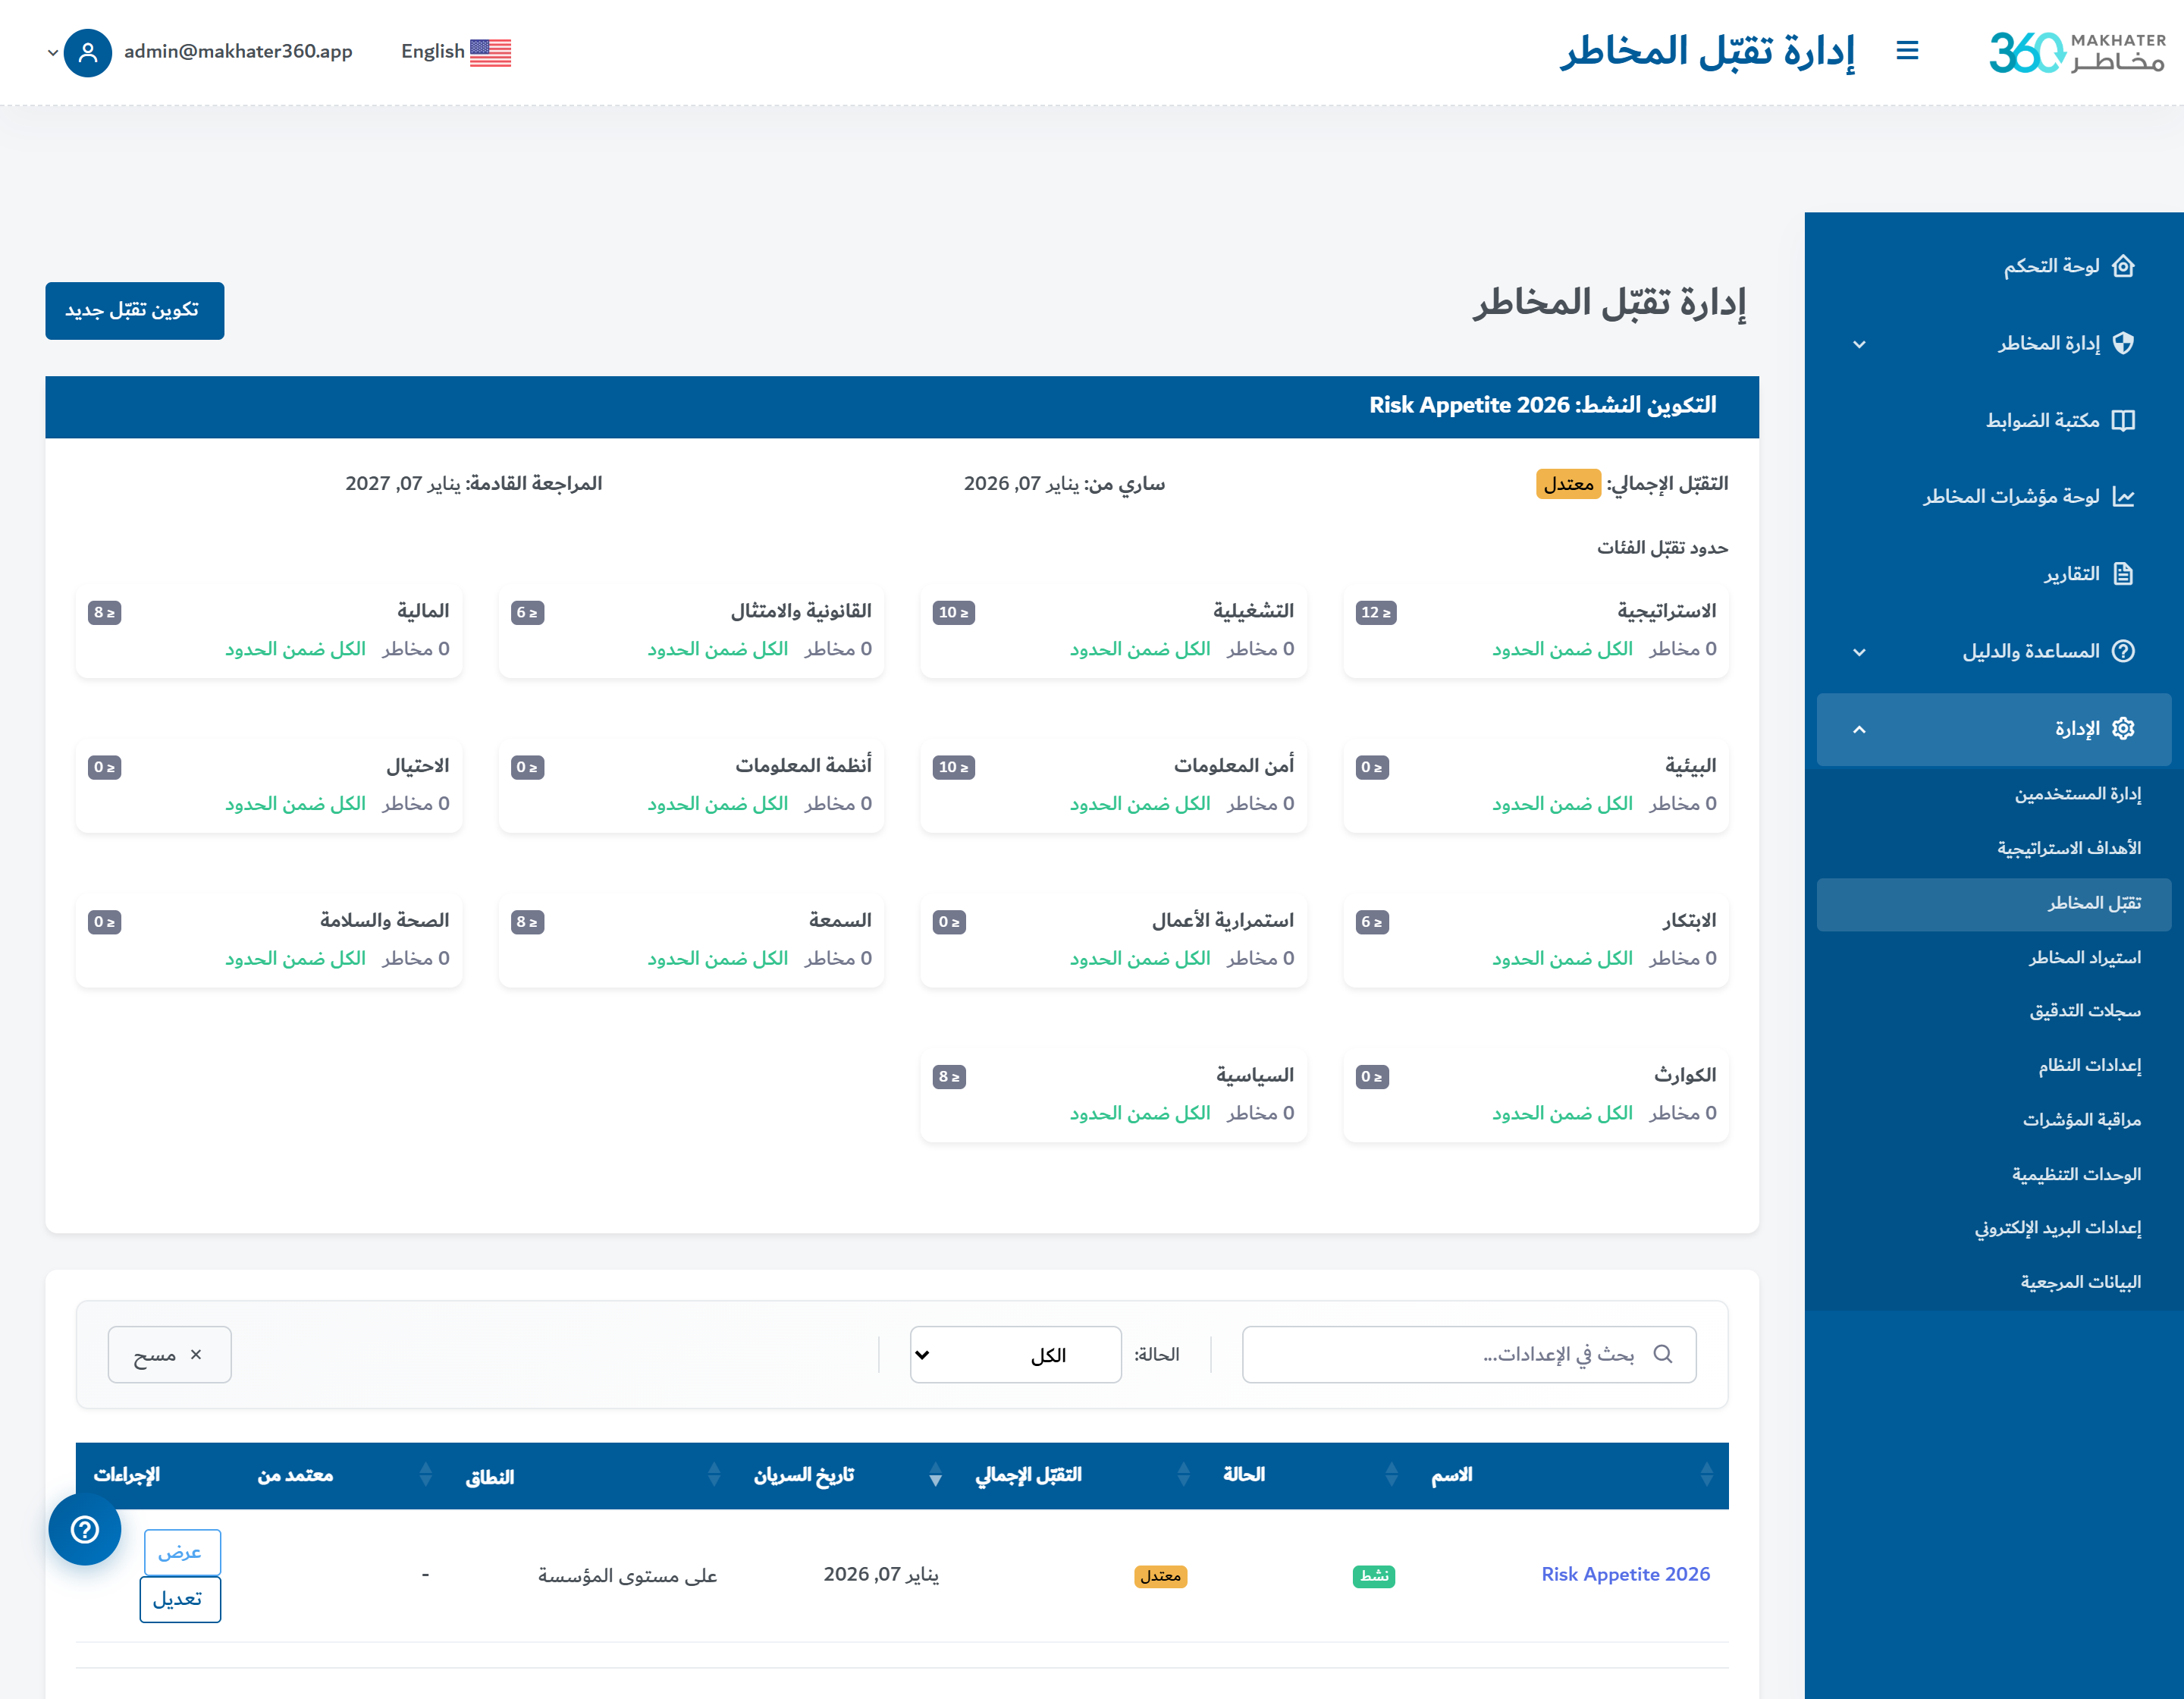
Risk Appetite
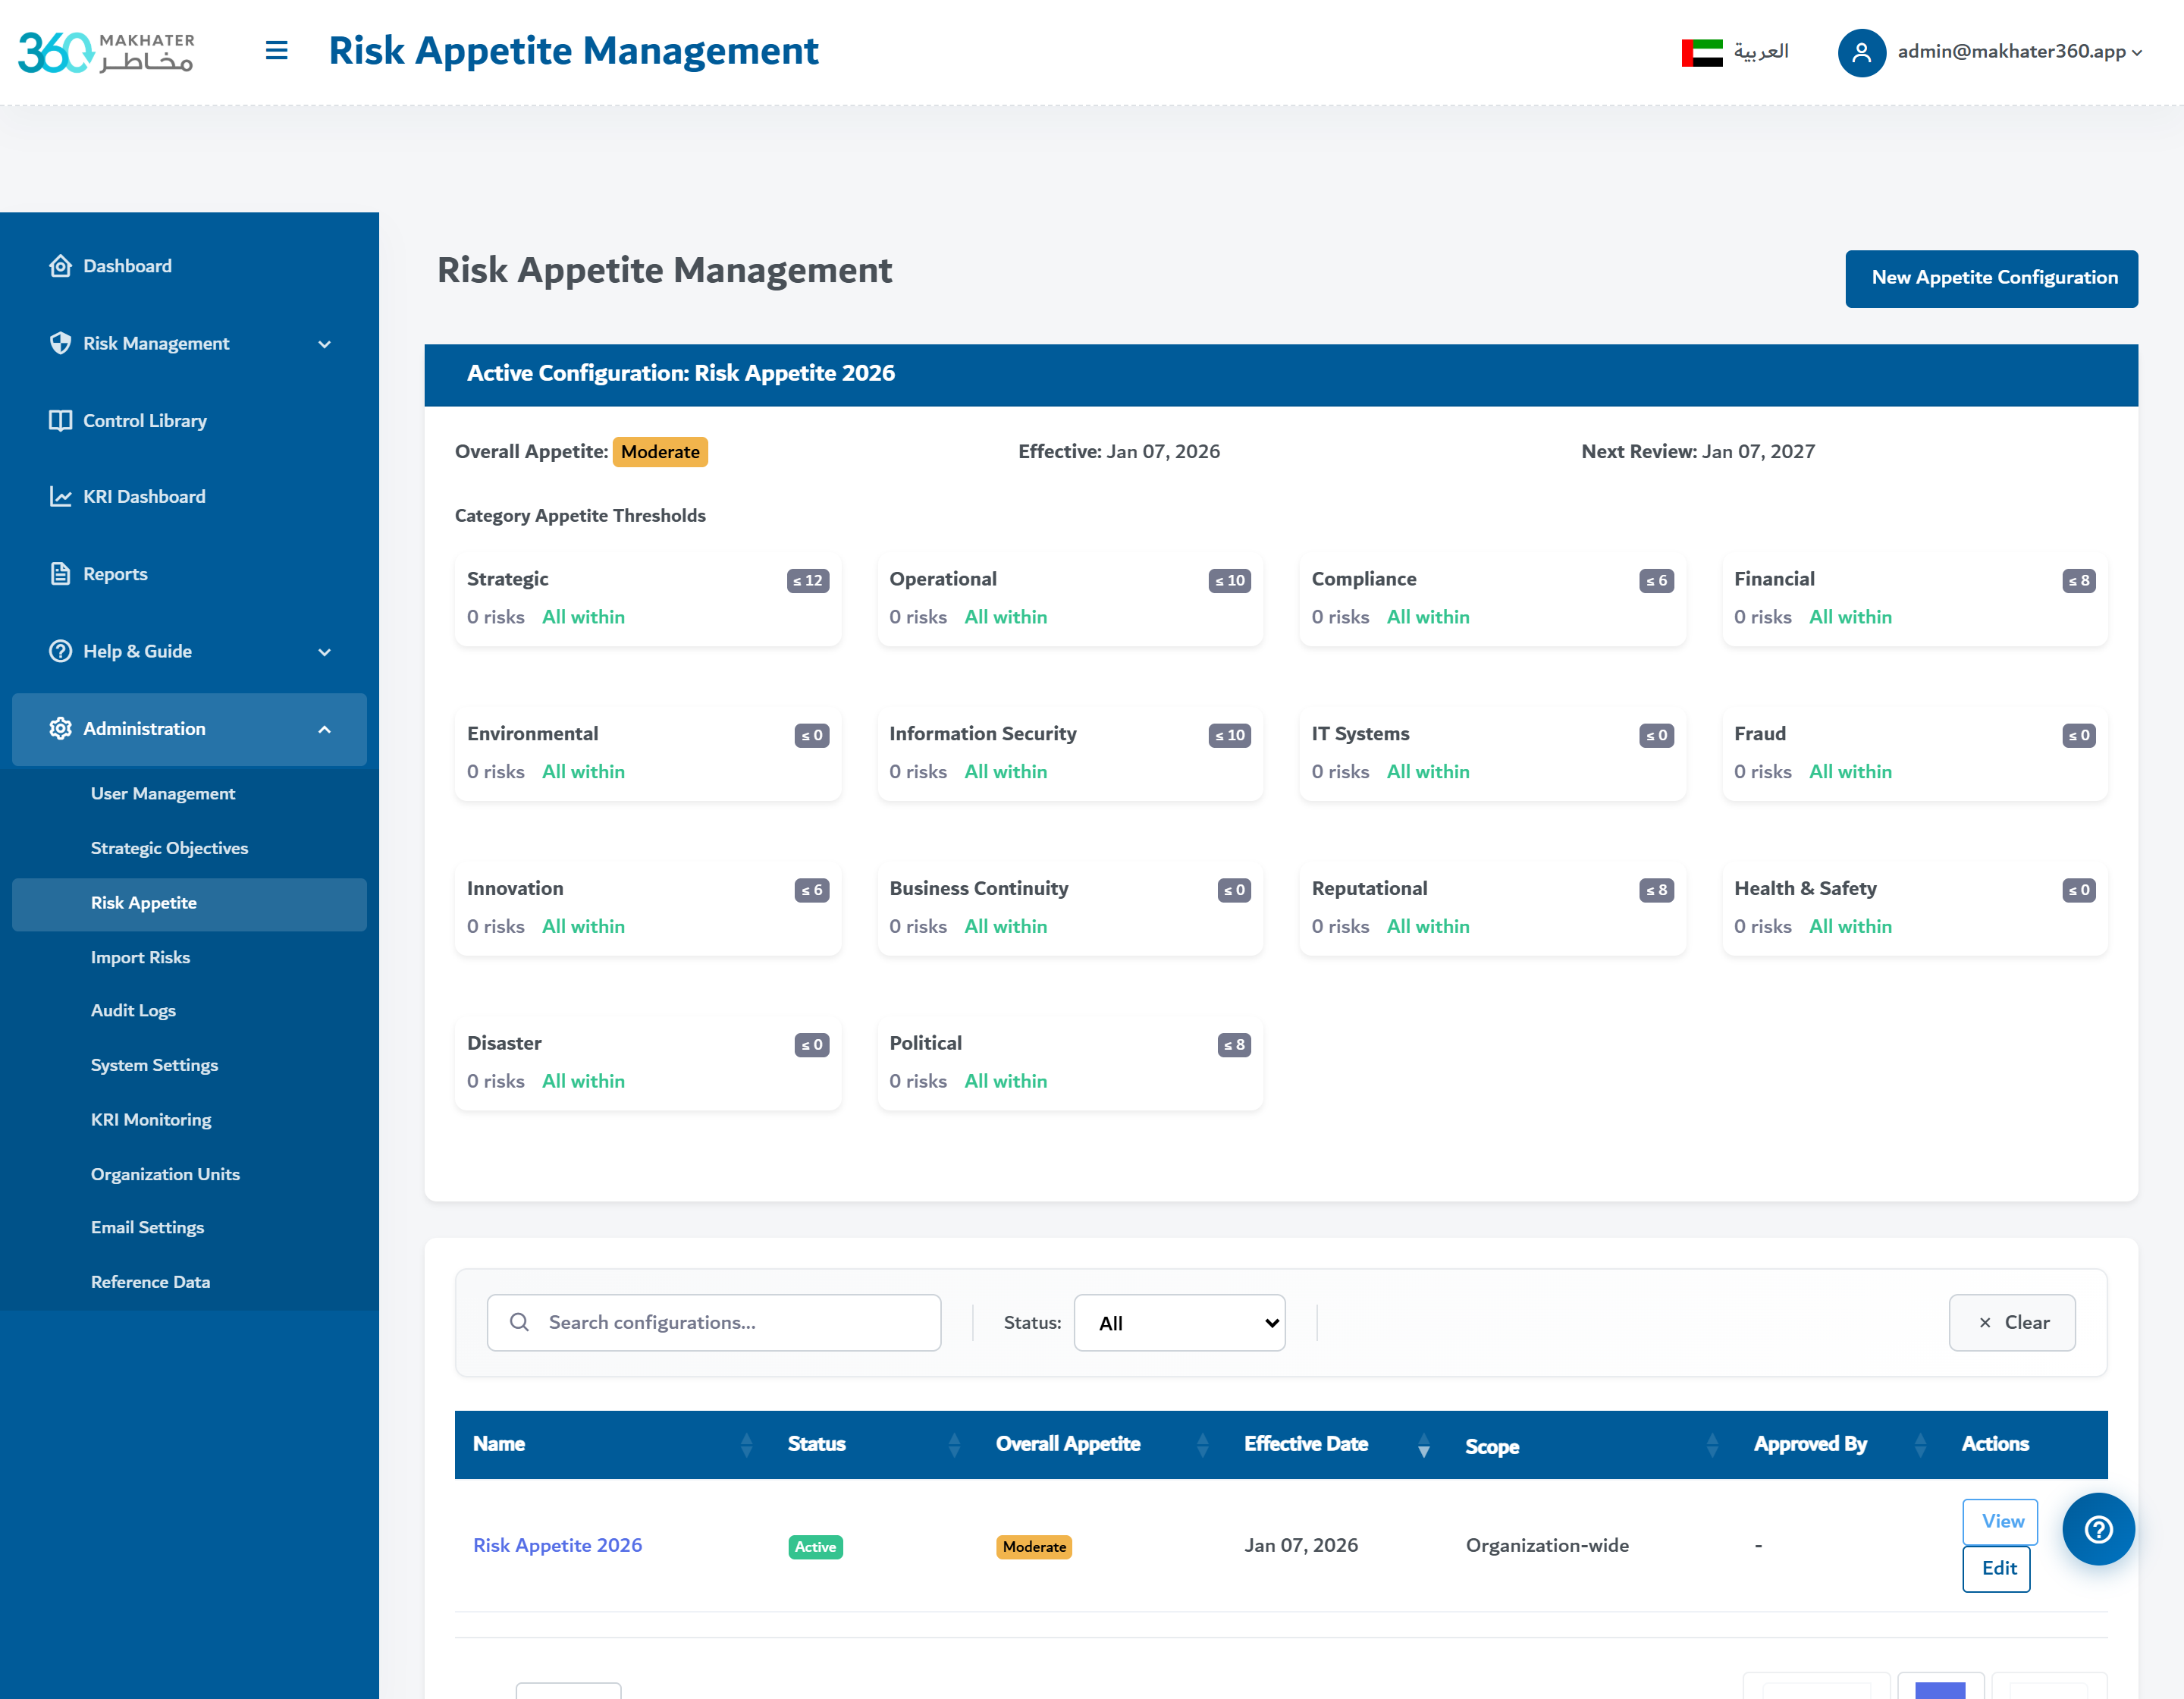
Set appetite and tolerance bands per category and per objective, then watch every residual score against them in real time. Makhater 360 flags every risk sitting outside appetite — no exposure hides behind an average.
Strategic Objectives
Map every risk to the strategic objective it threatens and every control to the objective it protects. Executives see risk through the lens of strategy — not as a detached register, but as context for every decision.
Risk Ideas
Crowdsource emerging risks from every department. Anyone can submit a risk candidate; the risk office reviews, promotes worthy candidates into the register, and keeps an auditable record of what was accepted, deferred or declined.
Reports & Analytics
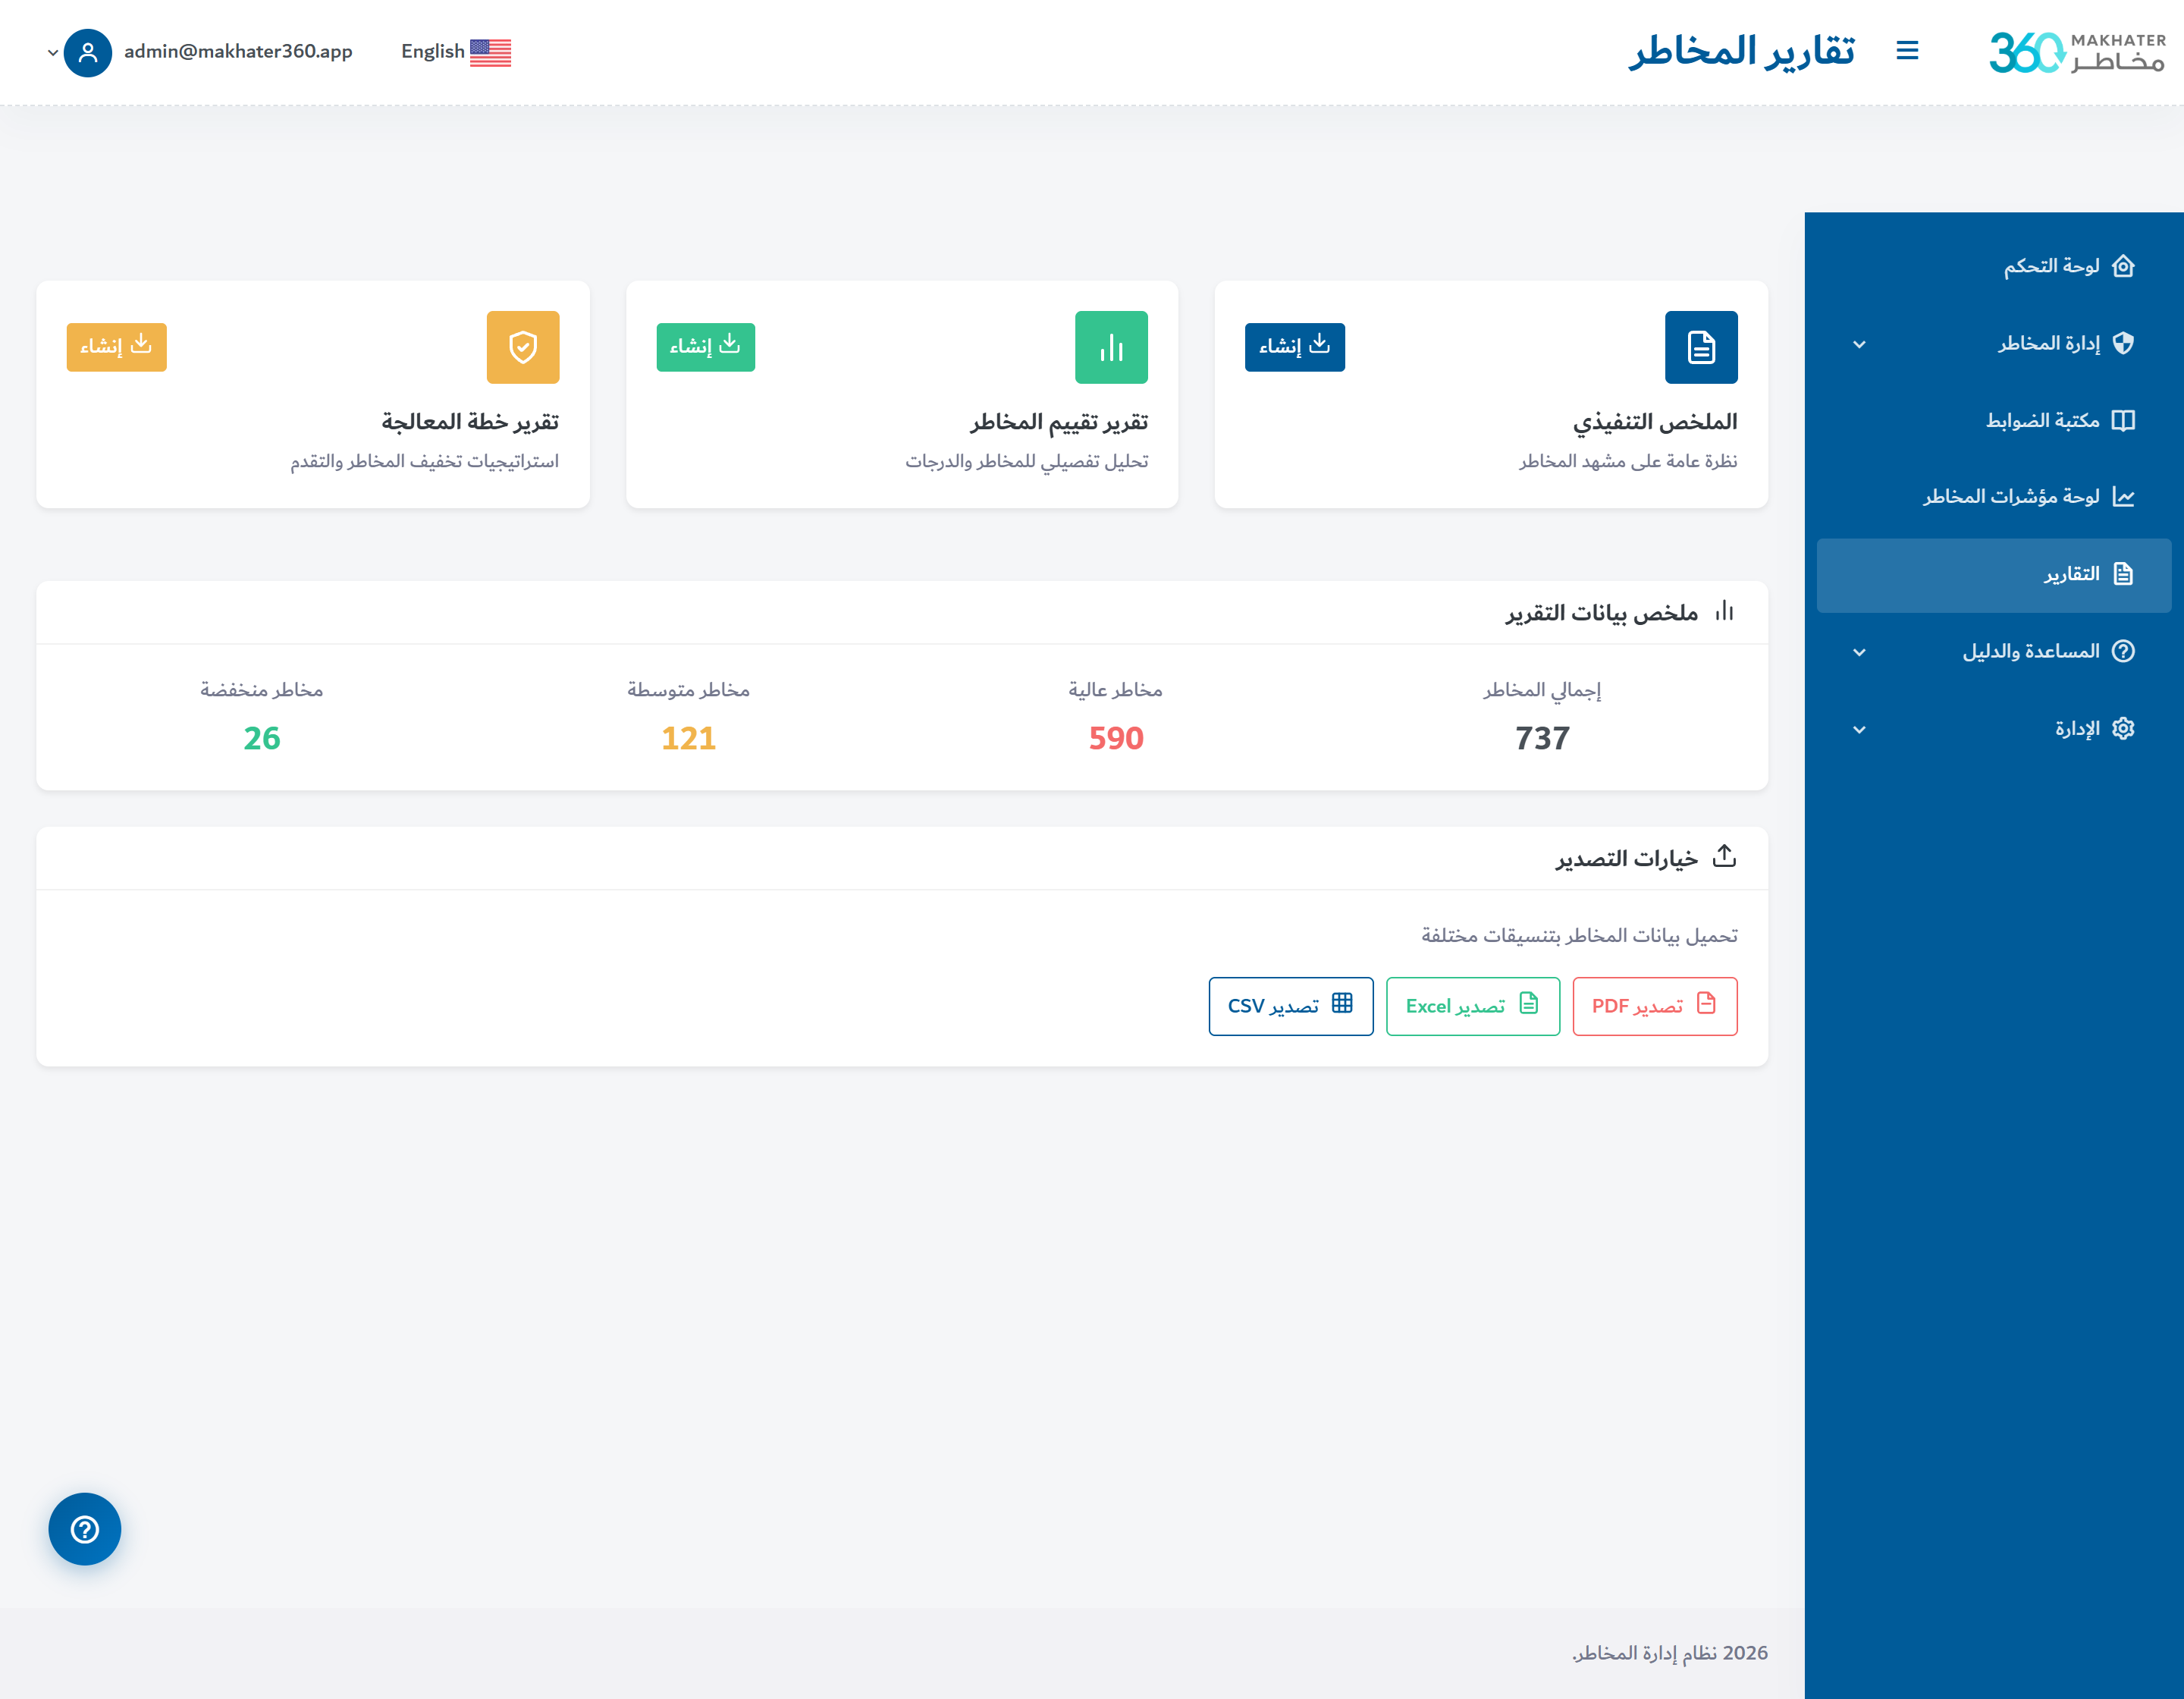
Standard and ad-hoc reports across risks, treatments, controls, KRIs and appetite — exportable to PDF, Excel and CSV. Scheduled delivery to leadership inboxes; drill-down from any chart to the underlying record in one click.
Governance & Bilingual UX
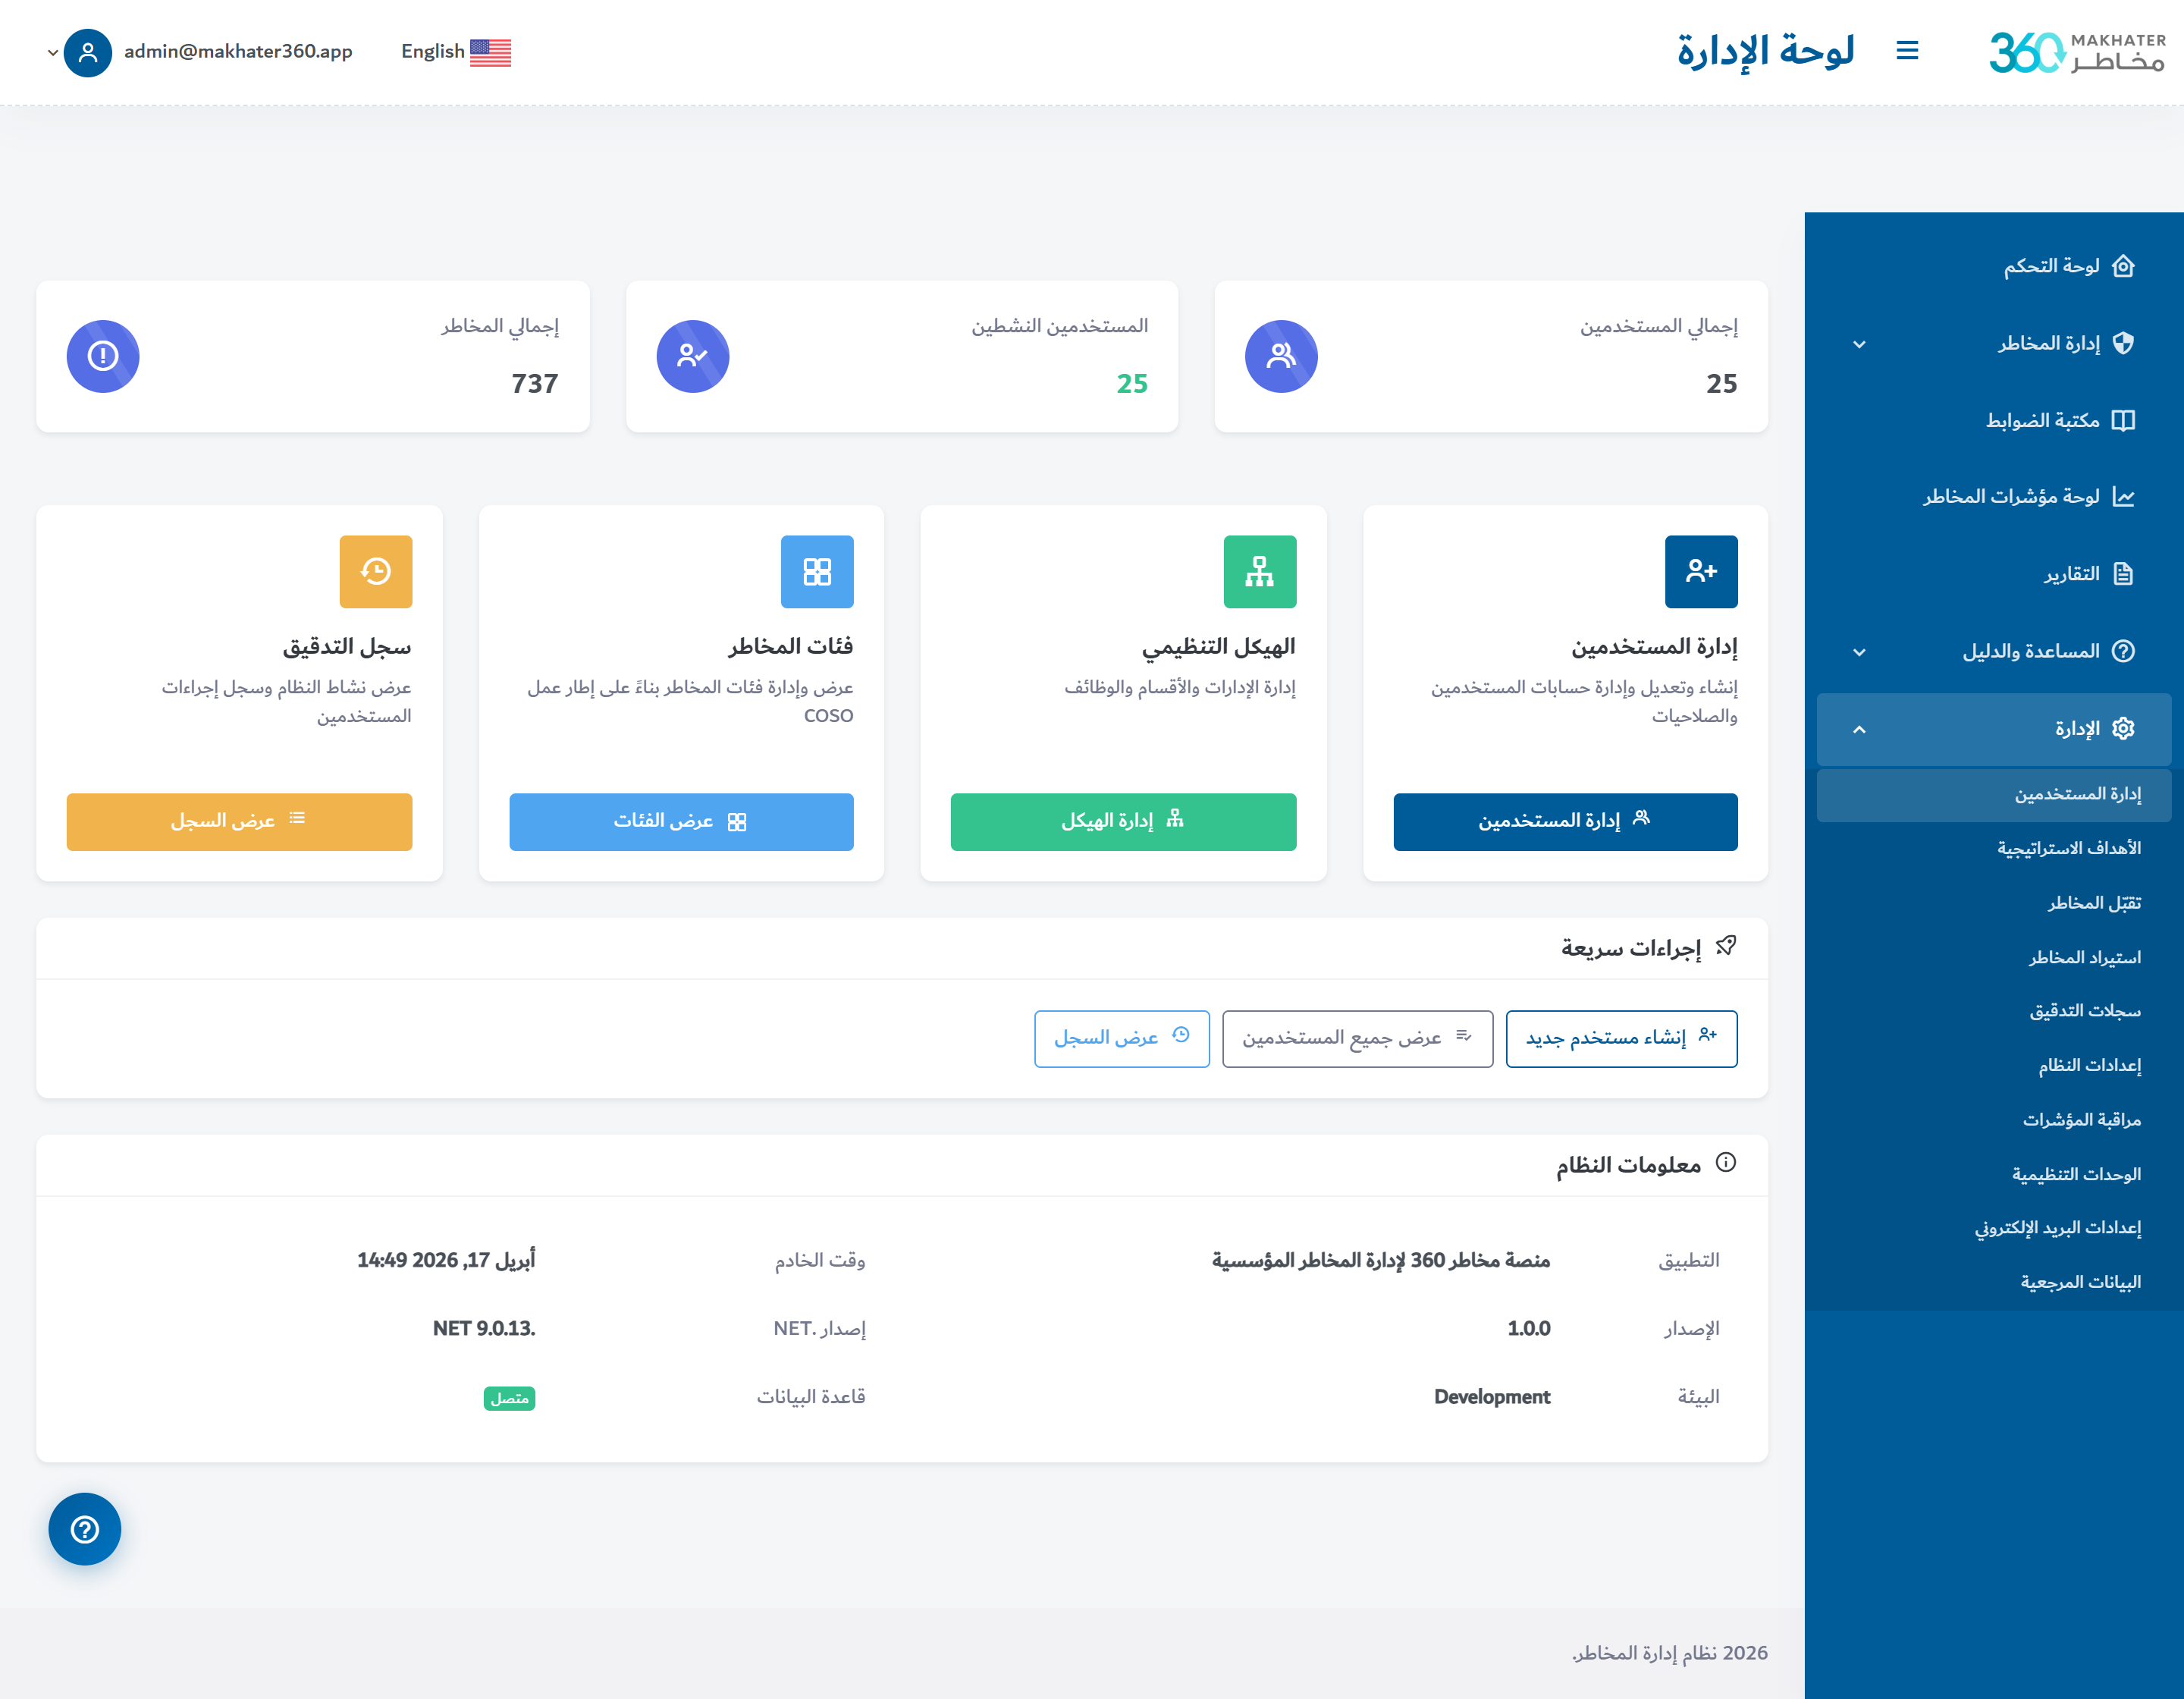
Role-based access, department-level scoping, and a full audit trail give every risk an owner and a scope. Fully bilingual English / Arabic (RTL) interface — switch language in one click without losing context.
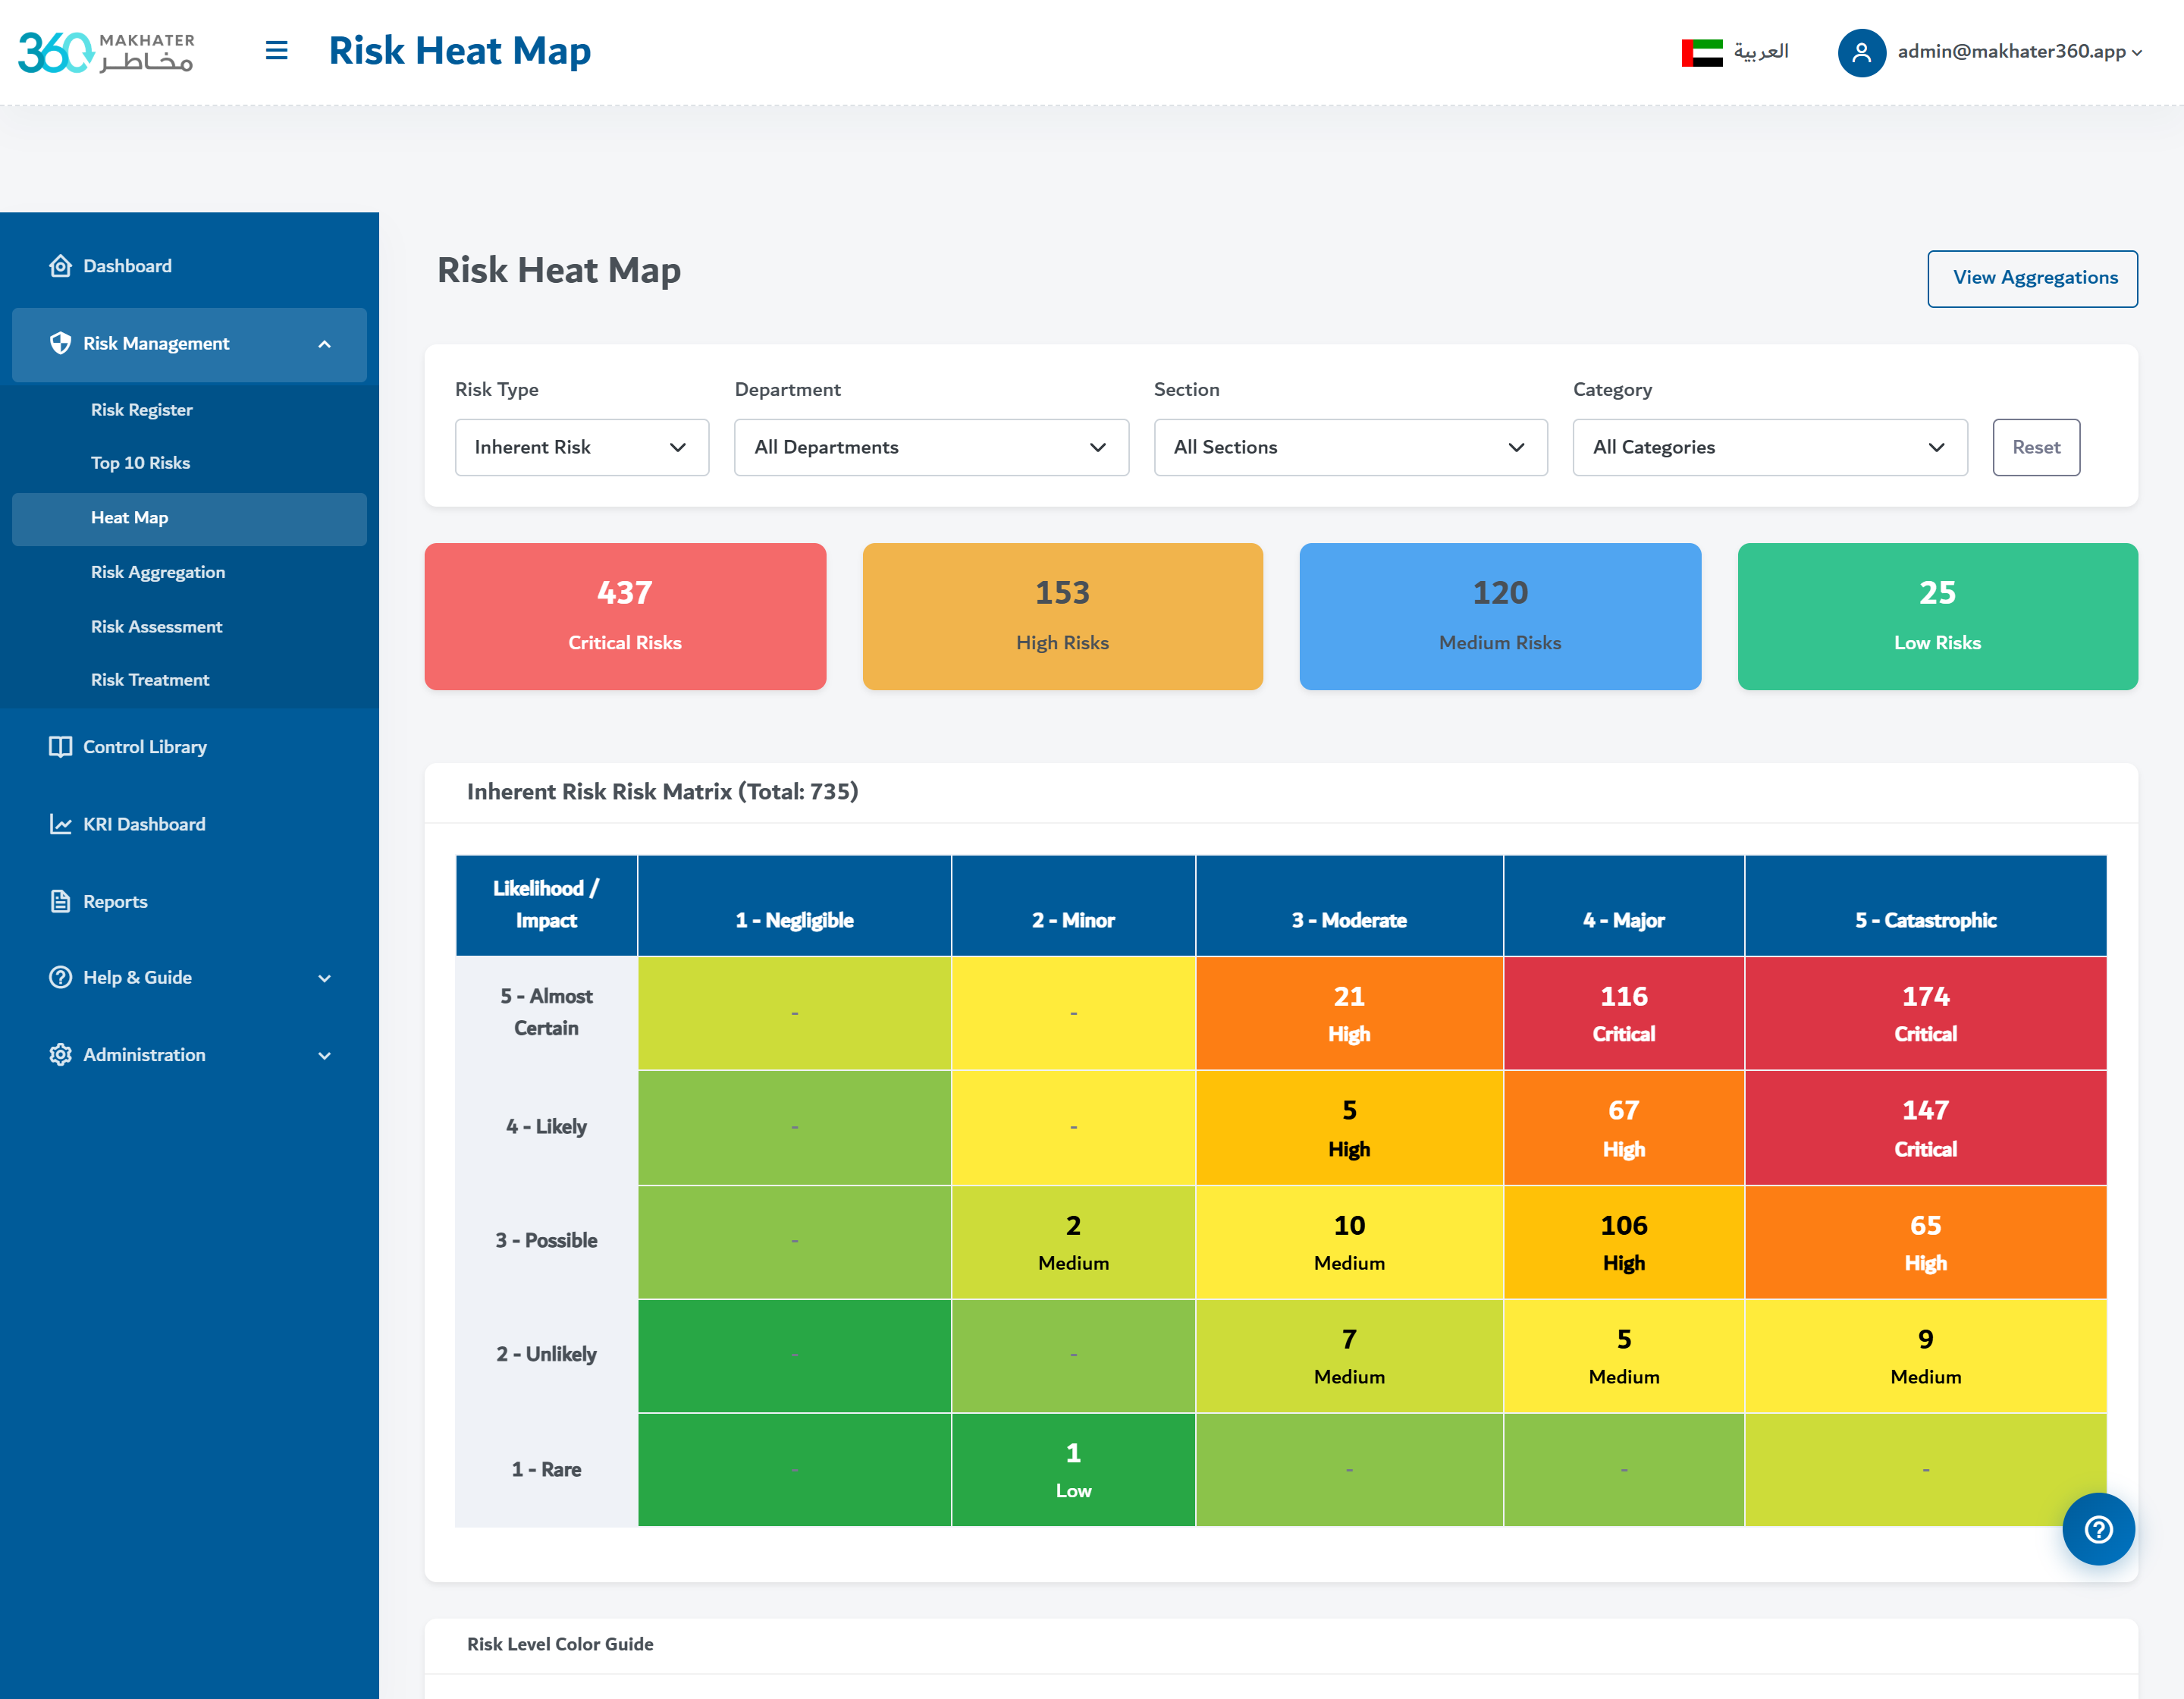
Capture Every Risk
End to End
One structured register for every enterprise risk — category, ownership, inherent and residual scoring, treatment state, controls and strategic-objective linkage on a single card.
- ✓APQC Level 1 – Level 3 HierarchyCategories, process groups and operational processes — modeled on the APQC Process Classification Framework.
- ✓BPMN LinkageEvery process links to its BPMN diagram, so architects and operators work off the same source of truth.
- ✓Complete Metadata ProfileOwners, systems of record, inputs, outputs, control points, KPIs and bilingual descriptions — all on one card.
- ✓Drill-Down NavigationMove from category to sub-process to artifact in one click — filter by owner, status, or organization unit.
Assess & Treat
With Discipline
A unified assessment and treatment backbone — so every risk is scored consistently, treated with ownership, and closed with evidence.
- ✓Unified Ticket BackboneOne data model under incidents, problems and change requests — with consistent assignment, SLA, and audit behavior.
- ✓Priority & Impact MatrixEvery record is triaged on an impact × urgency grid, with routing and SLA targets that follow the classification.
- ✓Root-Cause TrailProblems carry a full RCA log, known-error references and workarounds — resolved once, captured for the next time.
- ✓Governed Change ApprovalsStandard, normal and emergency paths with impact assessment, rollback plans and a full approval audit trail.
See Exposure
On One Heat Map
A live risk register assessed on a 5×5 Likelihood × Impact matrix, with treatment plans, tolerance bands and clear flags for everything sitting outside policy.
① 5×5 Heat Map
Likelihood × Impact grid with policy tolerance bands overlaid
② Outside-Tolerance Flags
Automatic flagging whenever a risk's residual score crosses its tolerance band
③ Treatment Plans
Mitigate, transfer, avoid, or accept — each with owner, target date and budget
④ Risk – Process Linkage
Every risk ties back to the process and service it threatens
⑤ Periodic Review Cadence
Quarterly, monthly or custom — with reviewer queues and reminders
Preventive Controls,
Early Warnings
Every control is tied to the risks it mitigates, rated for design and operating effectiveness. KRIs watch for threshold breaches and alert owners before exposure becomes surprise.
- ✓Initiative PortfolioRegister, prioritize and track improvement initiatives through to measured delivery — with owner, budget, timeline and outcome evidence.
- ✓Savings Tracked (AED & Hours)Cost and time savings tied directly to initiatives, with YTD roll-ups that leadership can trust.
- ✓Impact QuadrantsQuick wins, major projects, fill-ins and thankless tasks — triage opportunities by effort and impact at a glance.
- ✓Closed-Loop with CustomersCustomer feedback flows into improvement candidates, so voice of customer becomes action — not a graveyard.
Score Every Risk
Across Your Organization
Six scoring methods for enterprise risk — inherent, residual, weighted, category-rolled — from a single risk up to the full organization, computed in real time.
① Inherent Score
Pre-control Likelihood × Impact on a 5×5 matrix — what the risk is without mitigation
② Residual Score
Post-control Likelihood × Impact — what the risk actually is after mitigation
③ Category Rollup
Weighted aggregate across every risk in a category — the exposure leadership sees
④ Department Rollup
Aggregate across every risk a department owns — accountability by unit
⑤ Objective Rollup
Aggregate across every risk threatening a strategic objective — context for the board
⑥ Custom Formula Builder
Define your own scoring logic — custom weights, conditions, and treatment-adjusted formulas
Stay Ahead of
Every Threshold
Makhater 360 pushes the right alert to the right person at the right time — before KRIs breach, before appetite is exceeded, before exposure becomes surprise.
- ✓Early Warning Before KRI BreachConfigurable green/amber/red thresholds notify risk owners before an indicator turns red — no surprise escalations.
- ✓Outside-Appetite AlertsInstant notifications when a residual risk score crosses its tolerance band or when a category breaches its appetite.
- ✓Assessment & Treatment RemindersPending assessments, reviews and treatment actions are pushed to owners automatically — nothing stuck in queues.
- ✓Multi-Channel DeliveryAll notifications available via email and the in-system notification center — each user configures their own preferences.
Dashboards Leaders
Can Trust
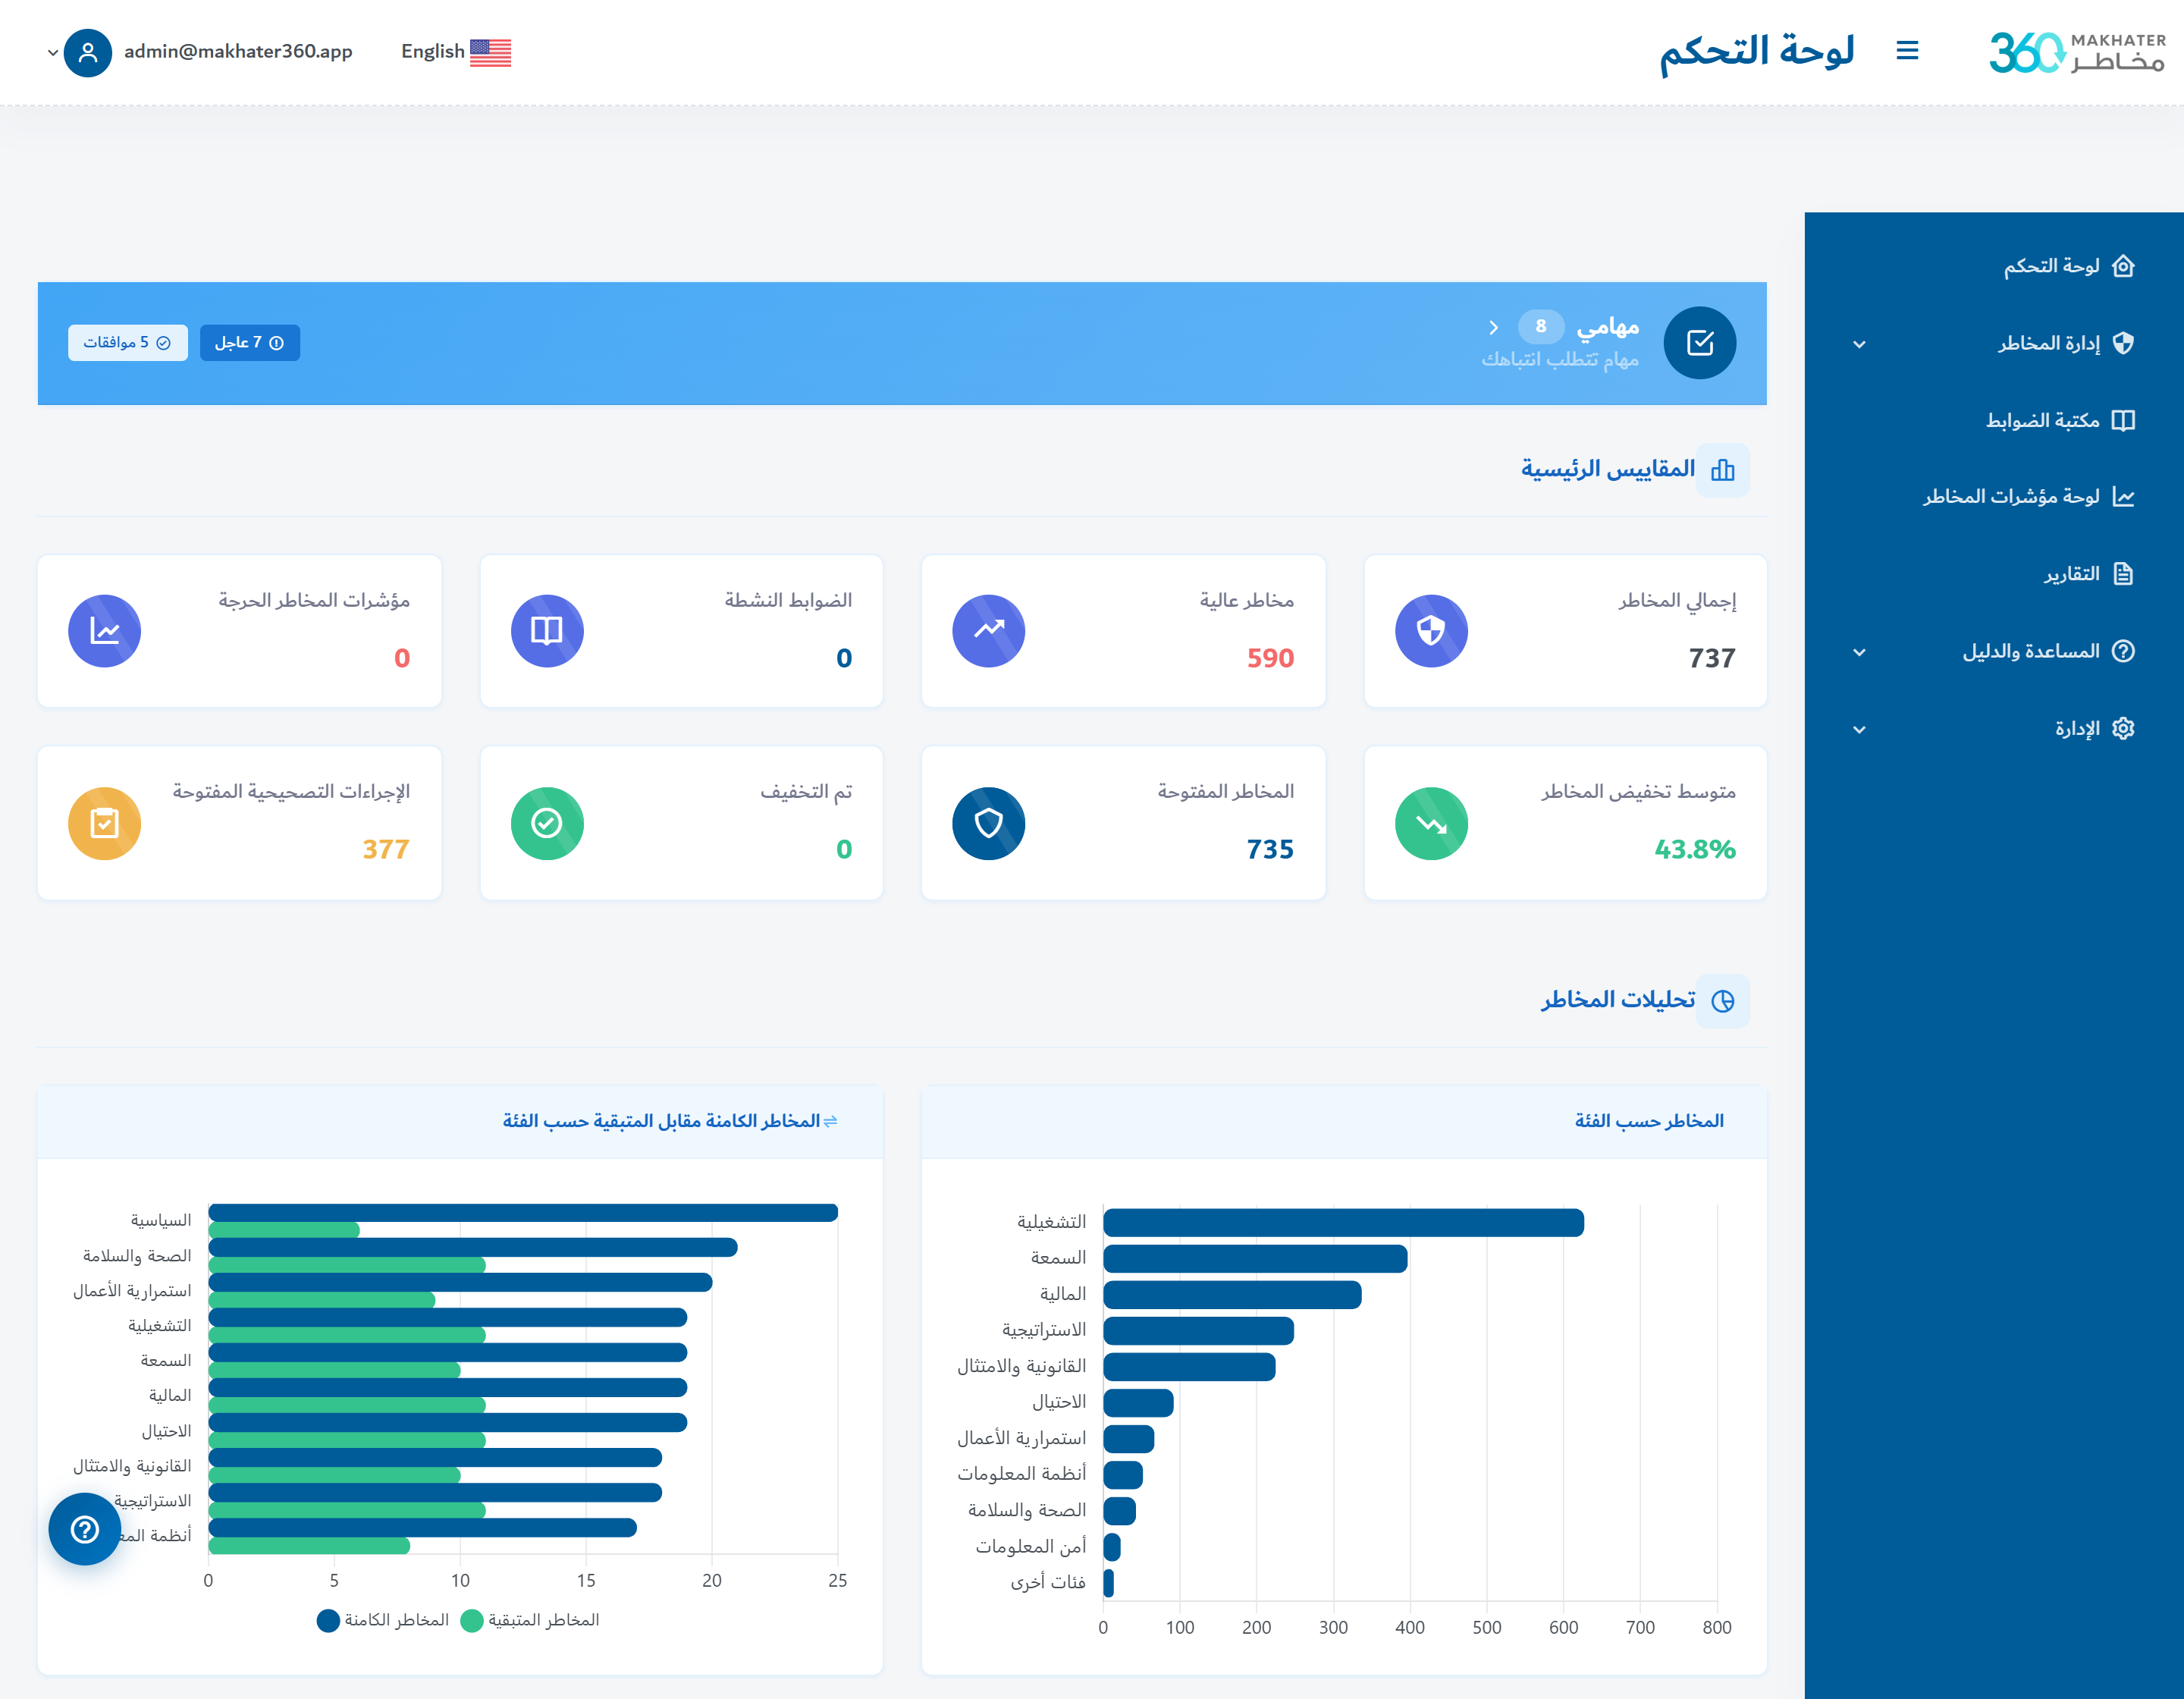
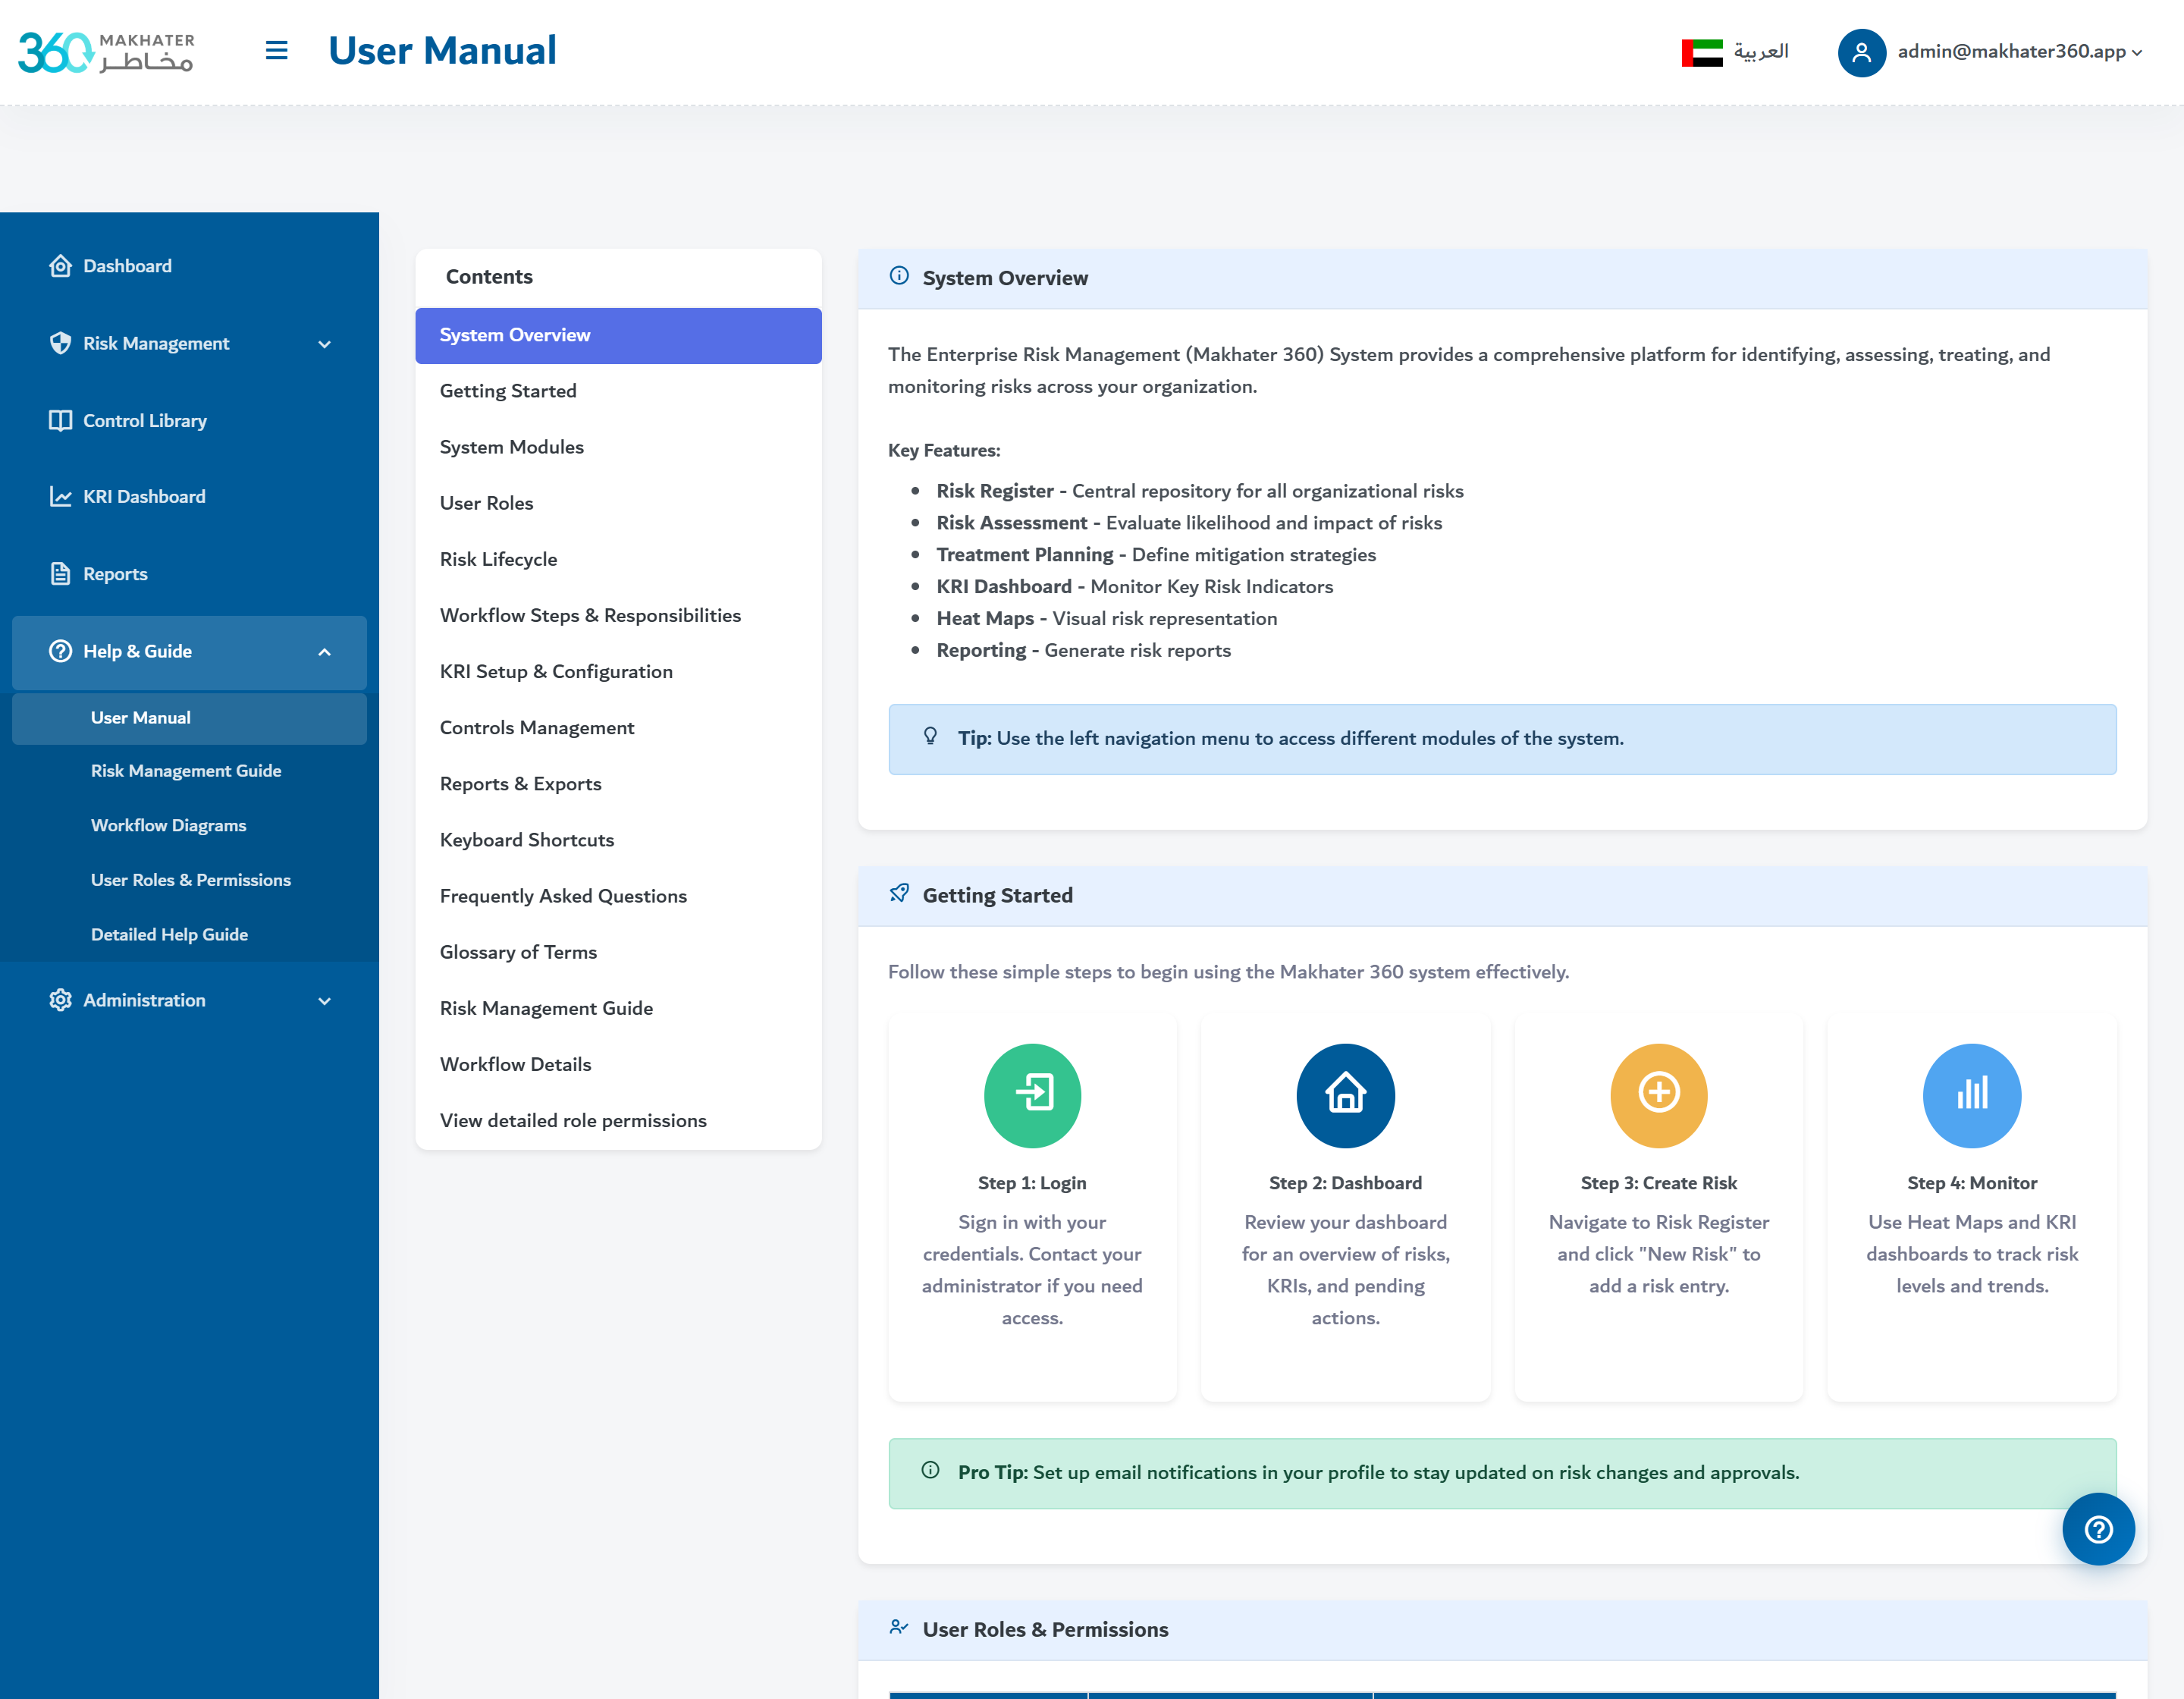
Interactive executive dashboards with role-specific views — drill from any chart down to the risk, treatment, control or KRI that produced it in one click.
- ✓Executive & Role-Based ViewsLeadership, department heads and analysts each get a dashboard tuned to the decisions they actually make.
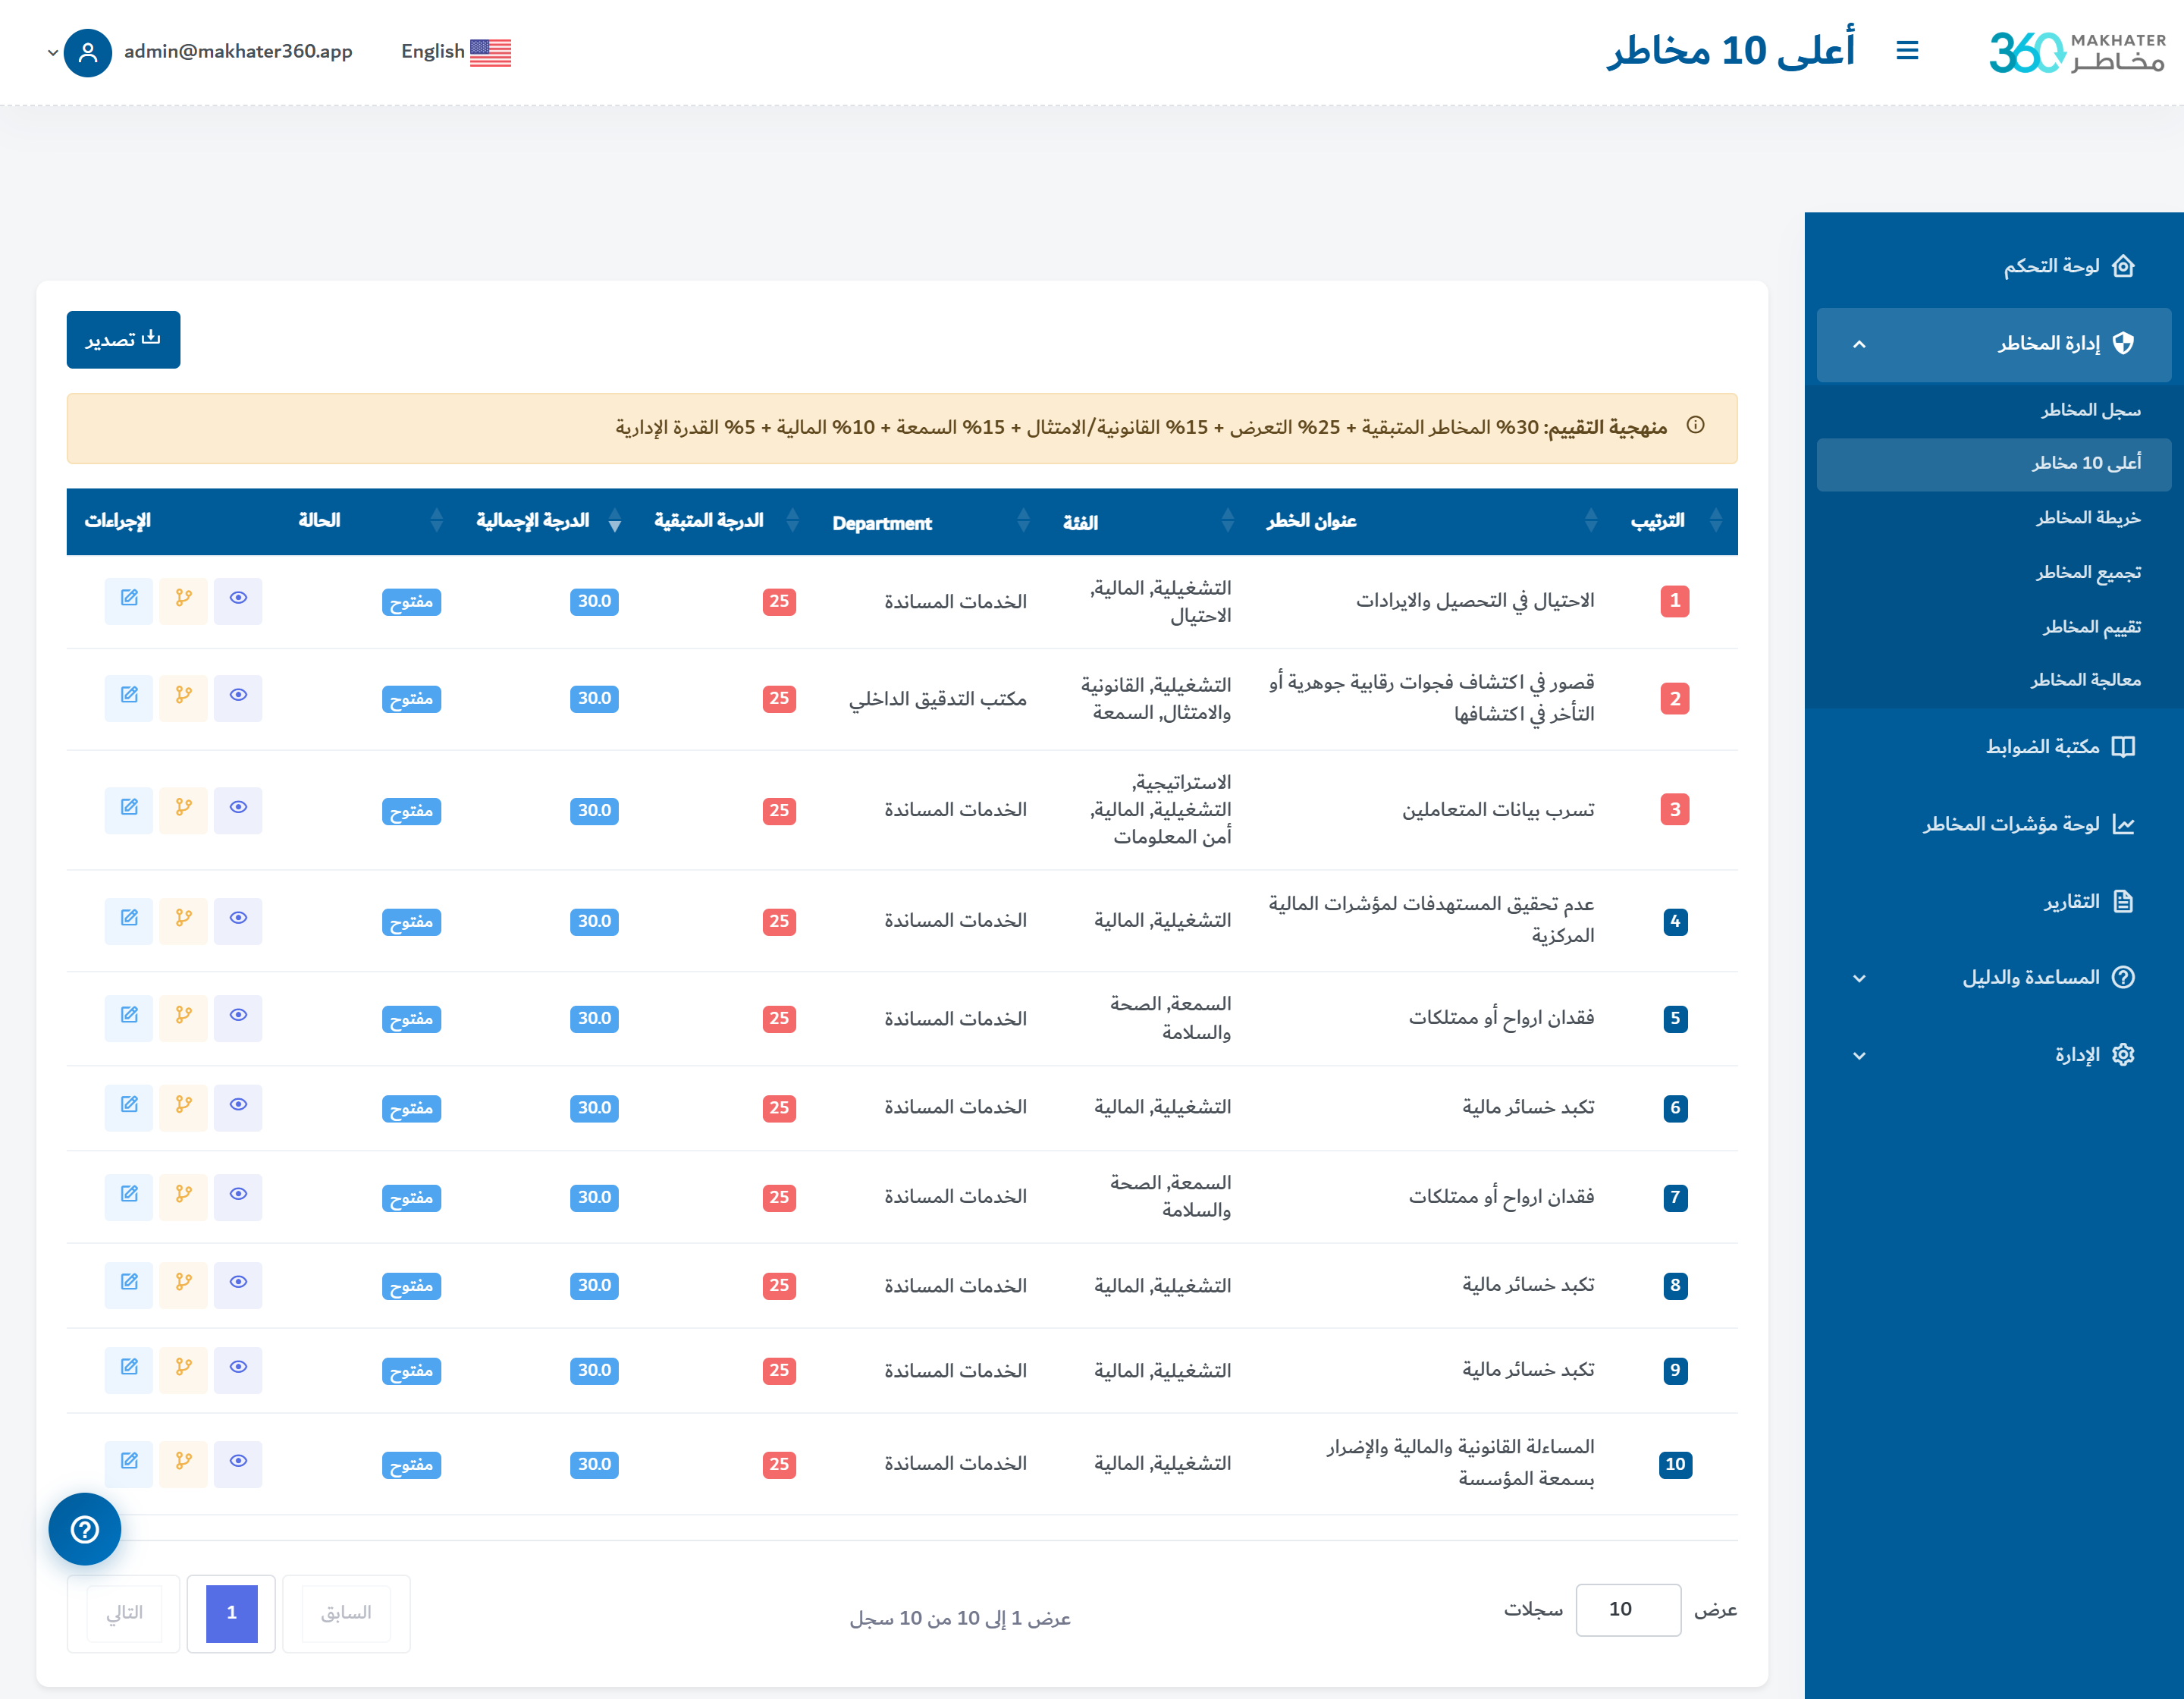
- ✓Full Risk Report SuiteRisk register, heat map, top risks, treatment status, control adequacy, KRI history, appetite status — all as canned and ad-hoc reports.
- ✓PDF, Excel & CSV ExportEvery report exports cleanly to PDF, Excel and CSV — with automated scheduling for periodic delivery.
- ✓Drill-Down NavigationClick any KPI, any bar, any score — and land on the underlying records behind the number.
Platform Foundations
Core capabilities that make Makhater 360 the right choice for complex, multi-unit organizations that need to govern enterprise risk — not just catalog it.
Fully Bilingual
Complete English & Arabic with RTL layout and regional formatting throughout the platform.
COSO / ISO 31000
Framework-aligned out of the box — terminology, workflow and control taxonomy follow industry standards.
Role-Based Access
Granular permissions via role groups and data-level scoping aligned to organization units.
Risk – Control – Objective
Every risk links to the controls that mitigate it and the strategic objective it threatens.
KRI Threshold Engine
Configurable green/amber/red bands per indicator — automatic alerts on breach with full history.
Governed Approvals
Multi-level review and endorsement workflows with tamper-evident audit trail for every action.
5×5 Heat Map
Every risk on a standard Likelihood × Impact matrix — inherent or residual, with outside-appetite flagging.
Appetite Governance
Appetite and tolerance bands per category, monitored continuously — every outside-appetite risk surfaces immediately.
Risk to Decision
in 6 Steps
A clear, governed pathway from modeling your operating architecture to proving the outcomes it delivers.
Model Your Operating Architecture
Build the APQC-aligned process hierarchy — categories, process groups and operational processes — with owners, systems of record, controls and BPMN linkage, in English and Arabic.
Catalog Services & Assets
Publish a clear service catalog mapped to the processes that deliver each service, and register every asset that powers it — with categories, relationships, custodians and lifecycle status.
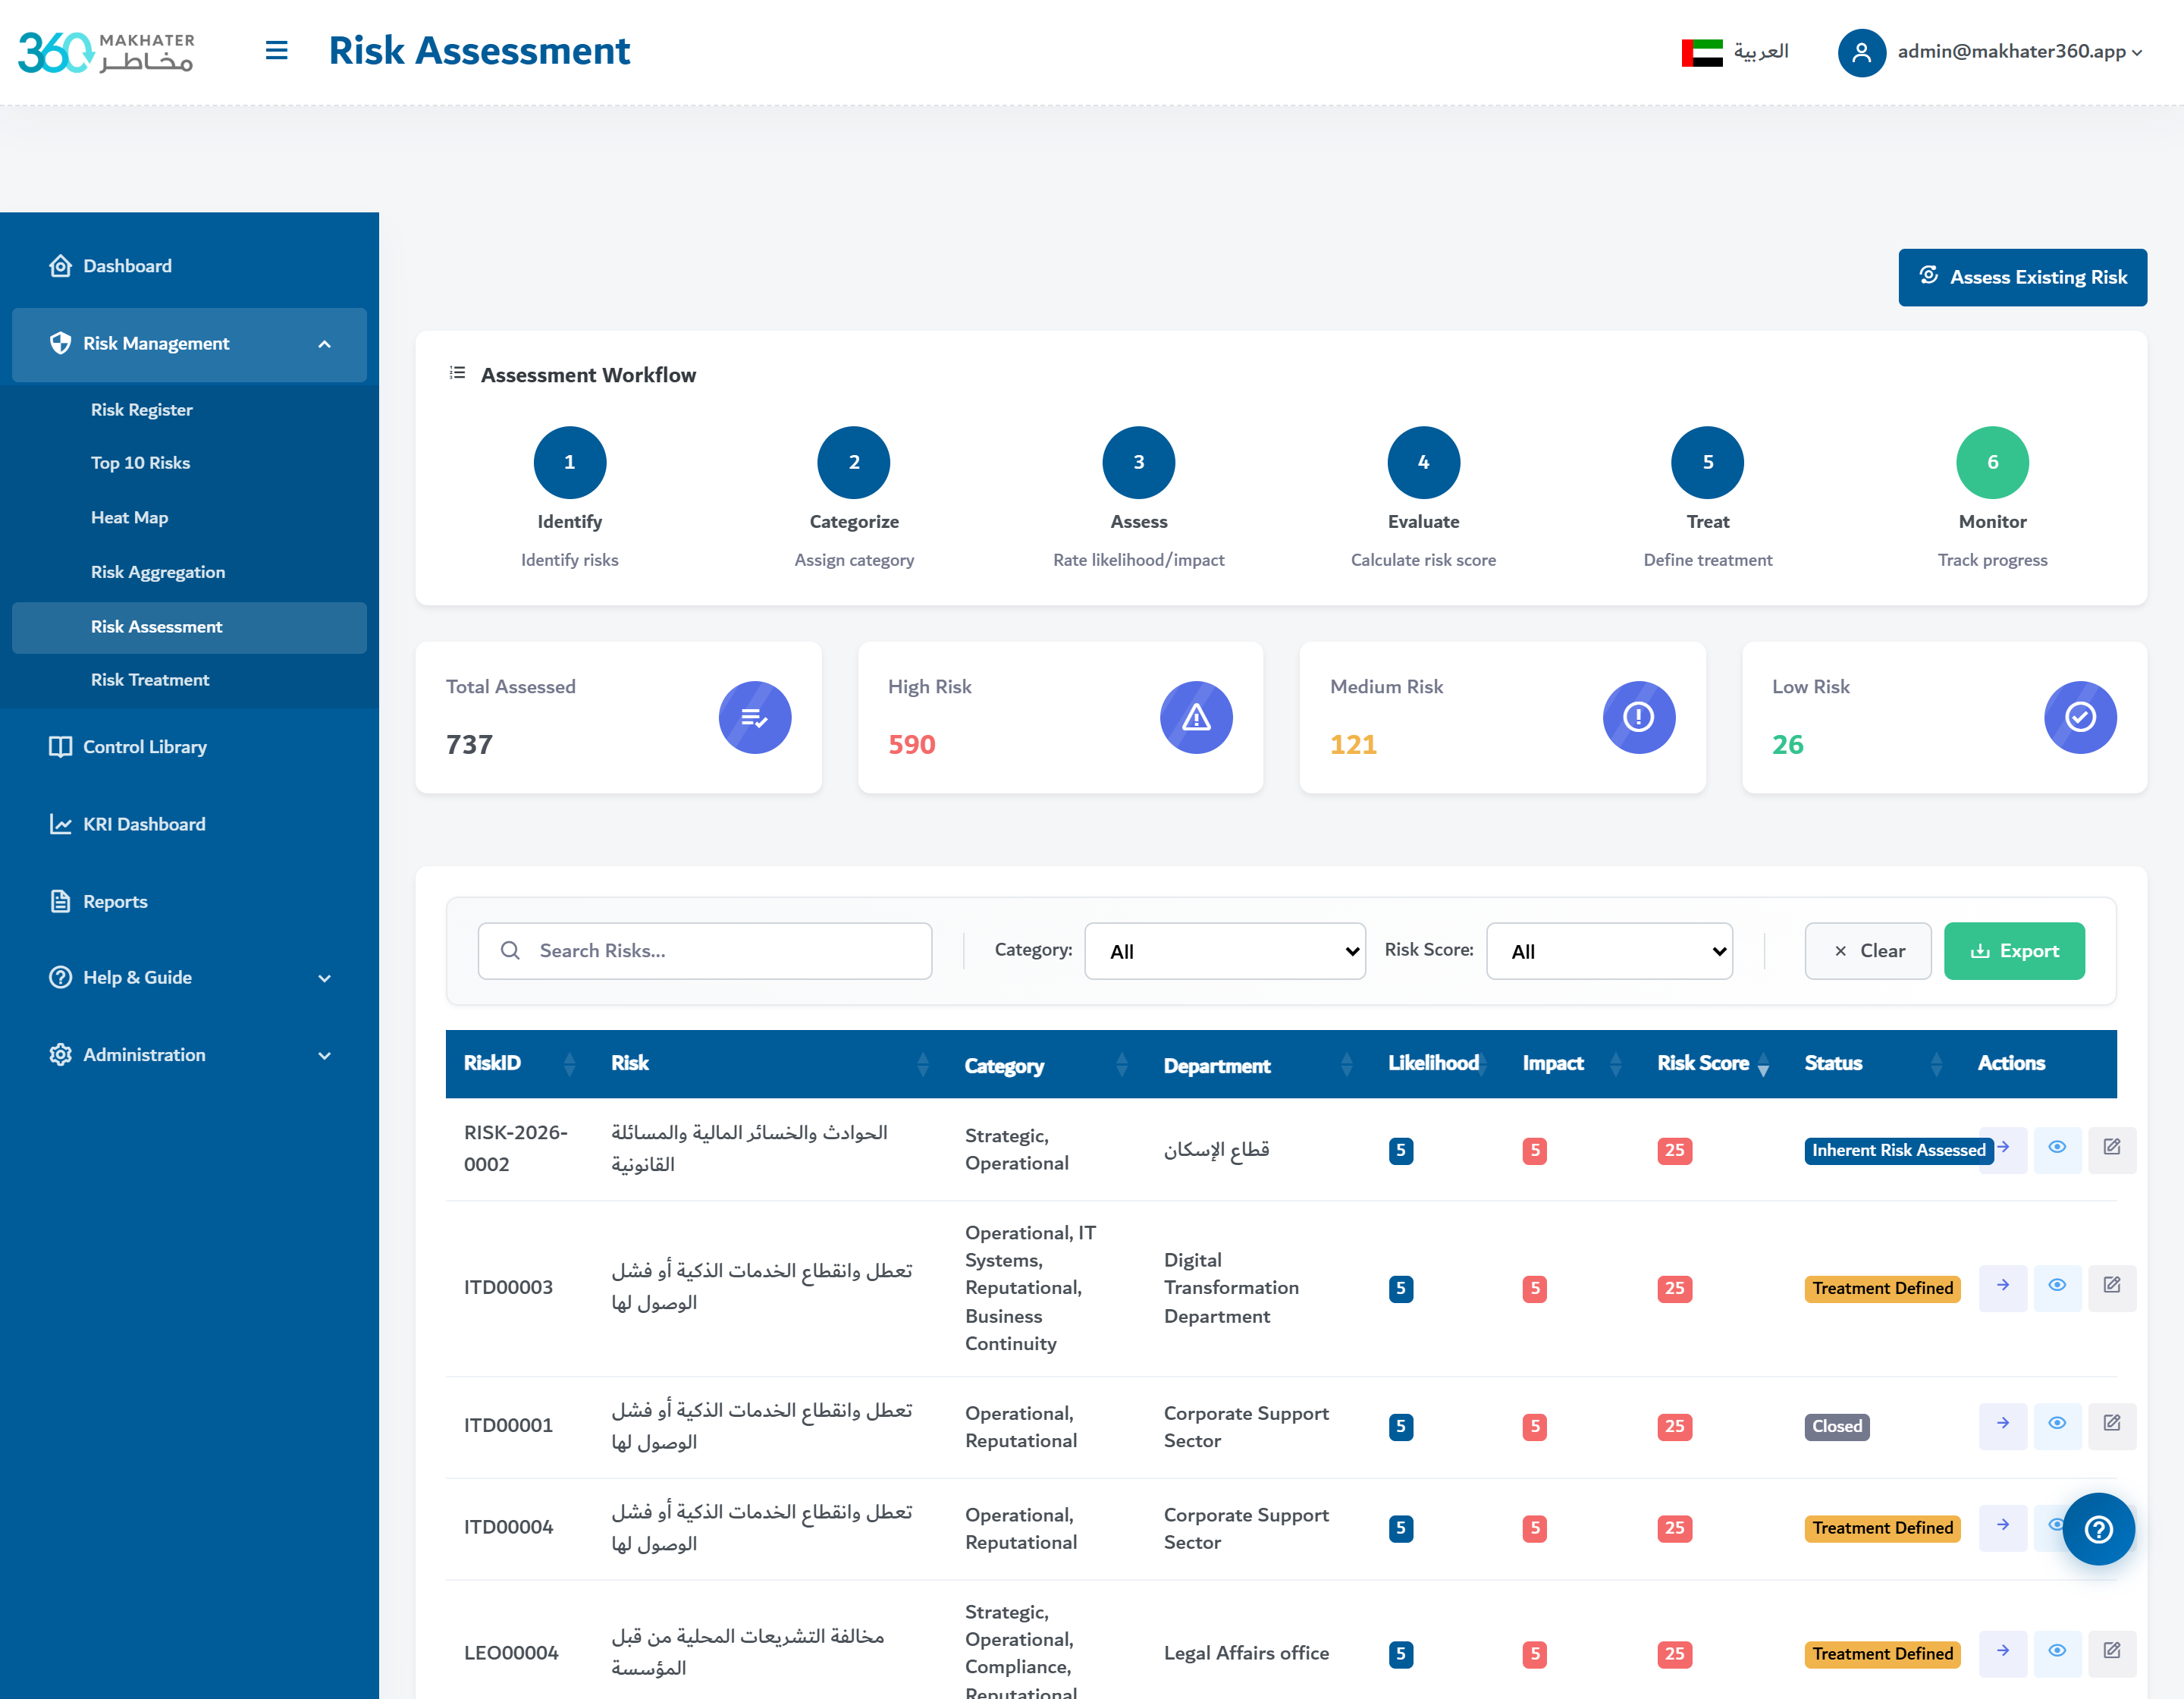
Run Operations With Discipline
Intake, triage and resolve incidents, problems and change requests on a single backbone. Priority matrices, assignment routing, and SLA tracking keep work moving and stakeholders informed.
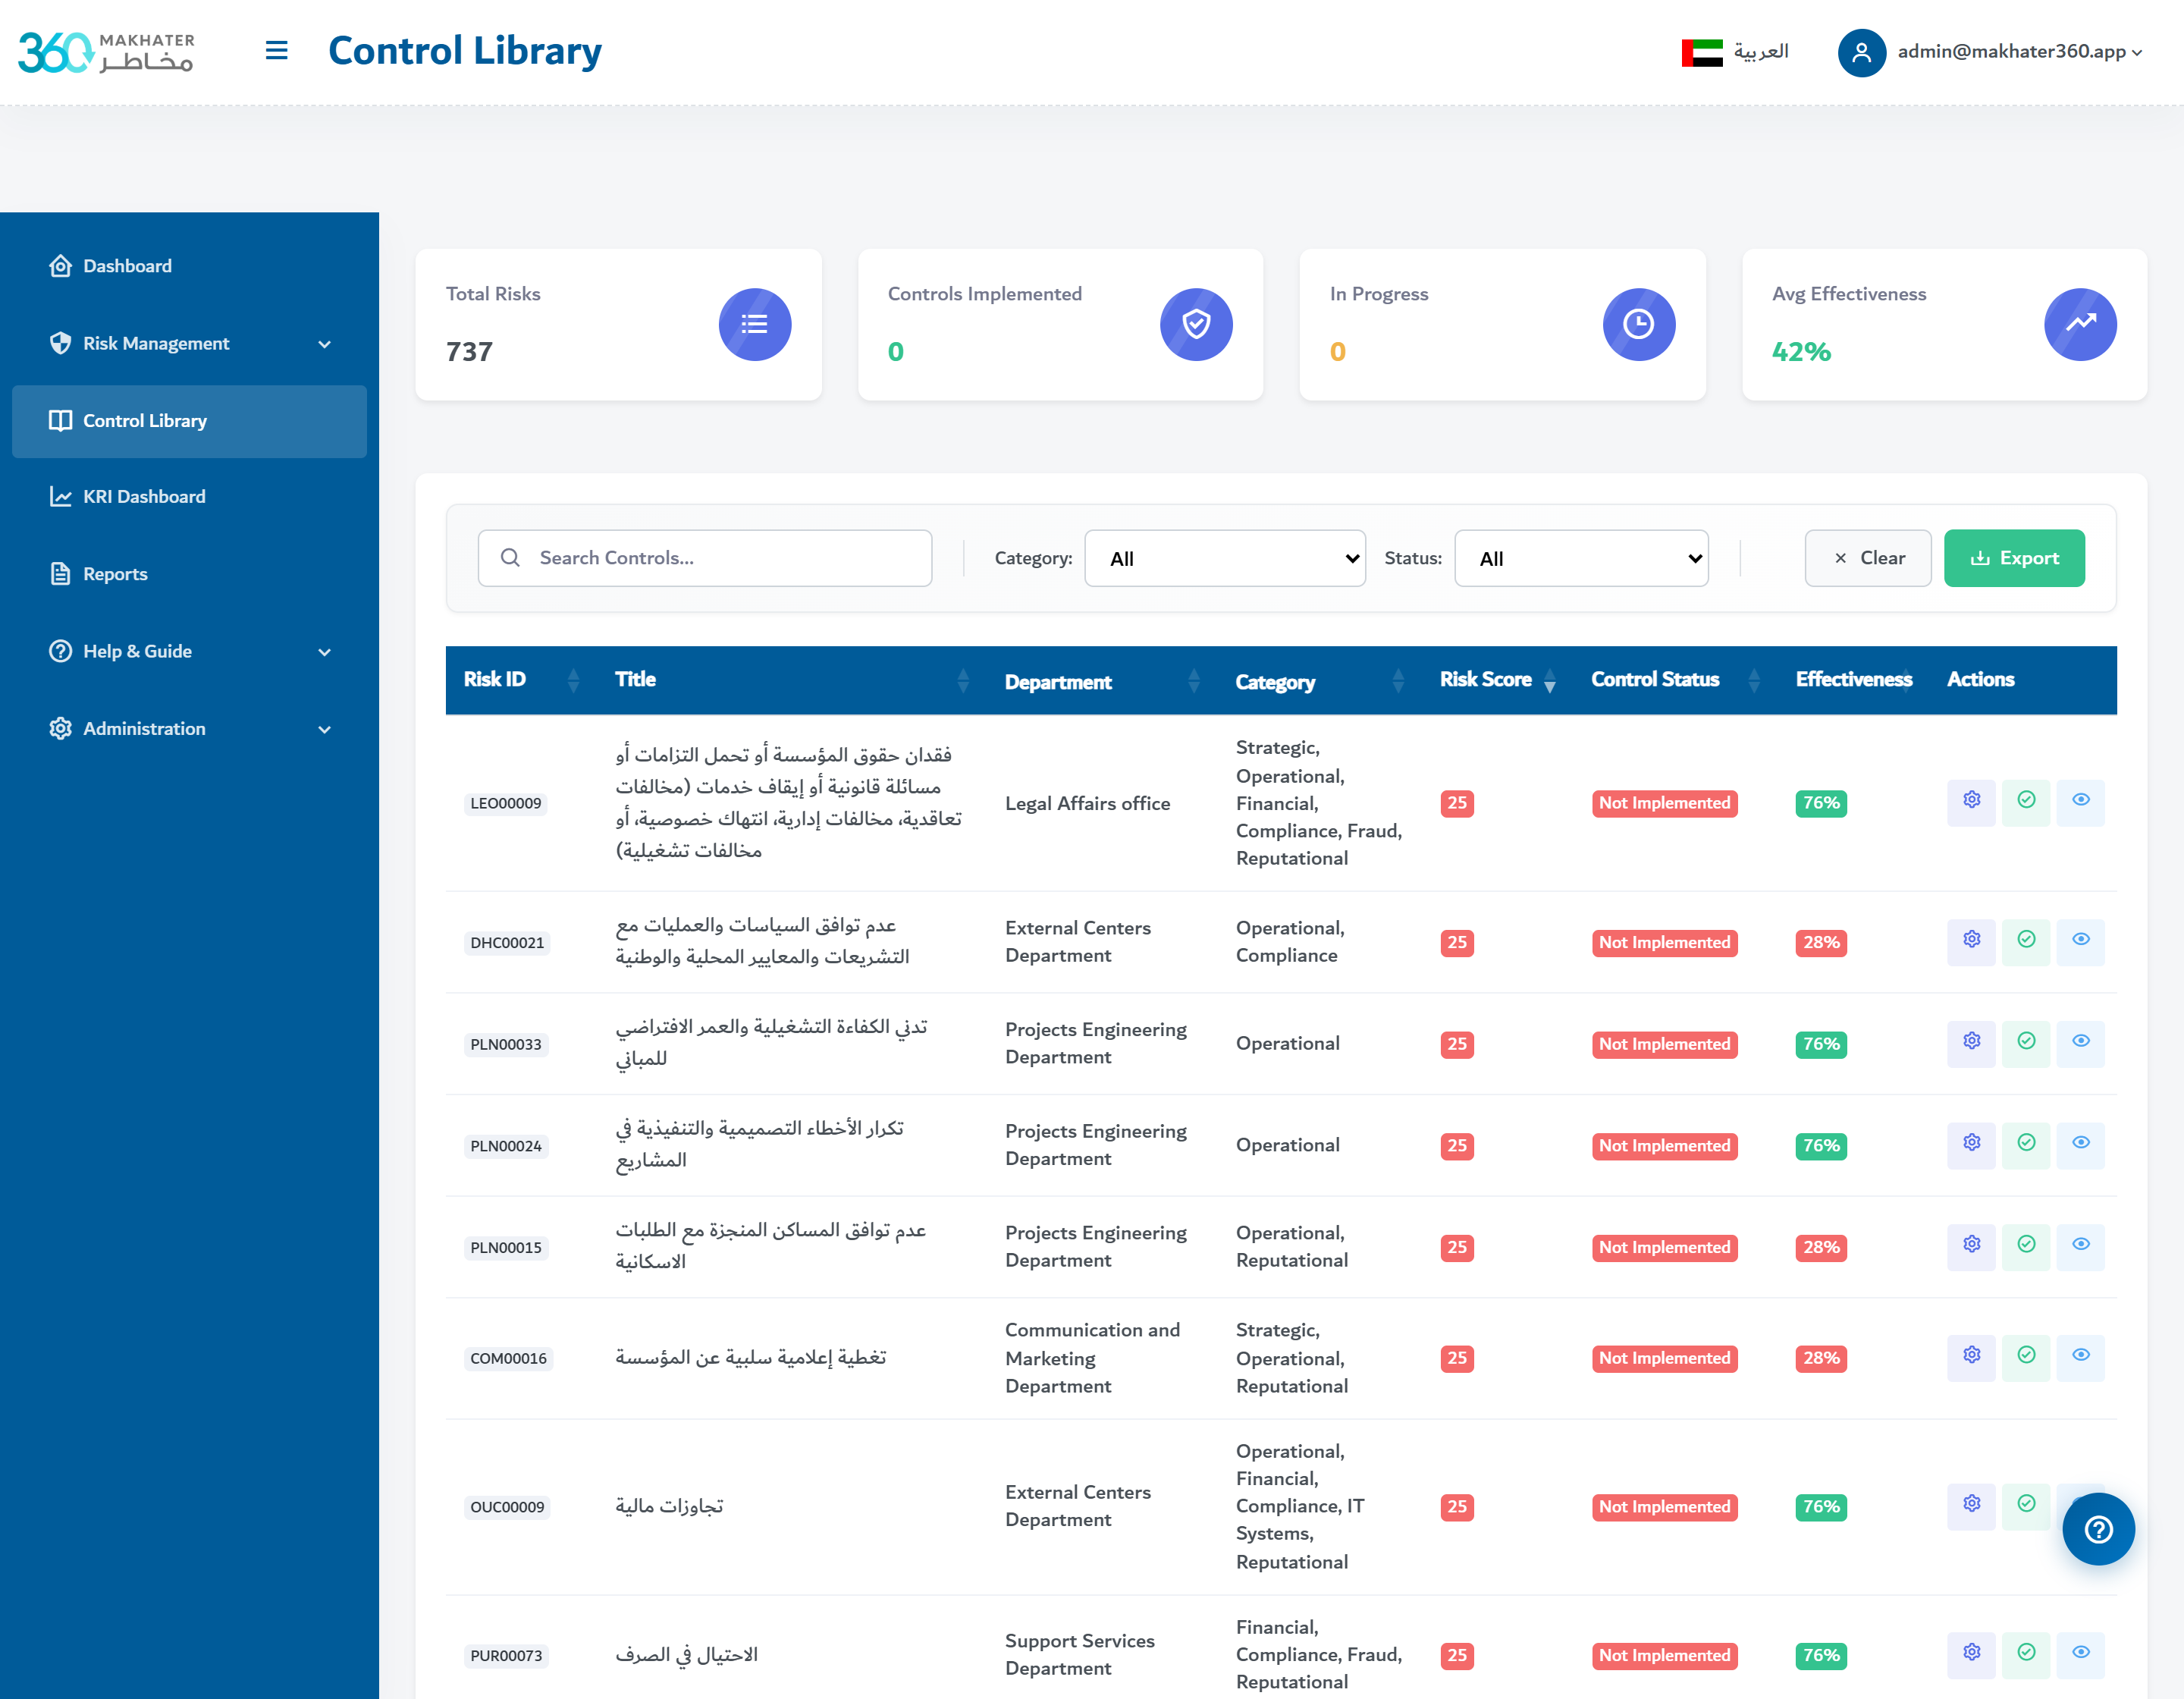
Govern Risk & SLAs
Assess enterprise risks on a 5×5 heat map with tolerance bands and treatment plans. Track SLA targets, breaches and warning trends — with outside-tolerance and breach flags no one can miss.
Drive Continuous Improvement
Turn ideas into initiatives with owners, budgets and outcome evidence. Track cost and time savings, triage opportunities into impact quadrants, and close the loop on customer feedback.
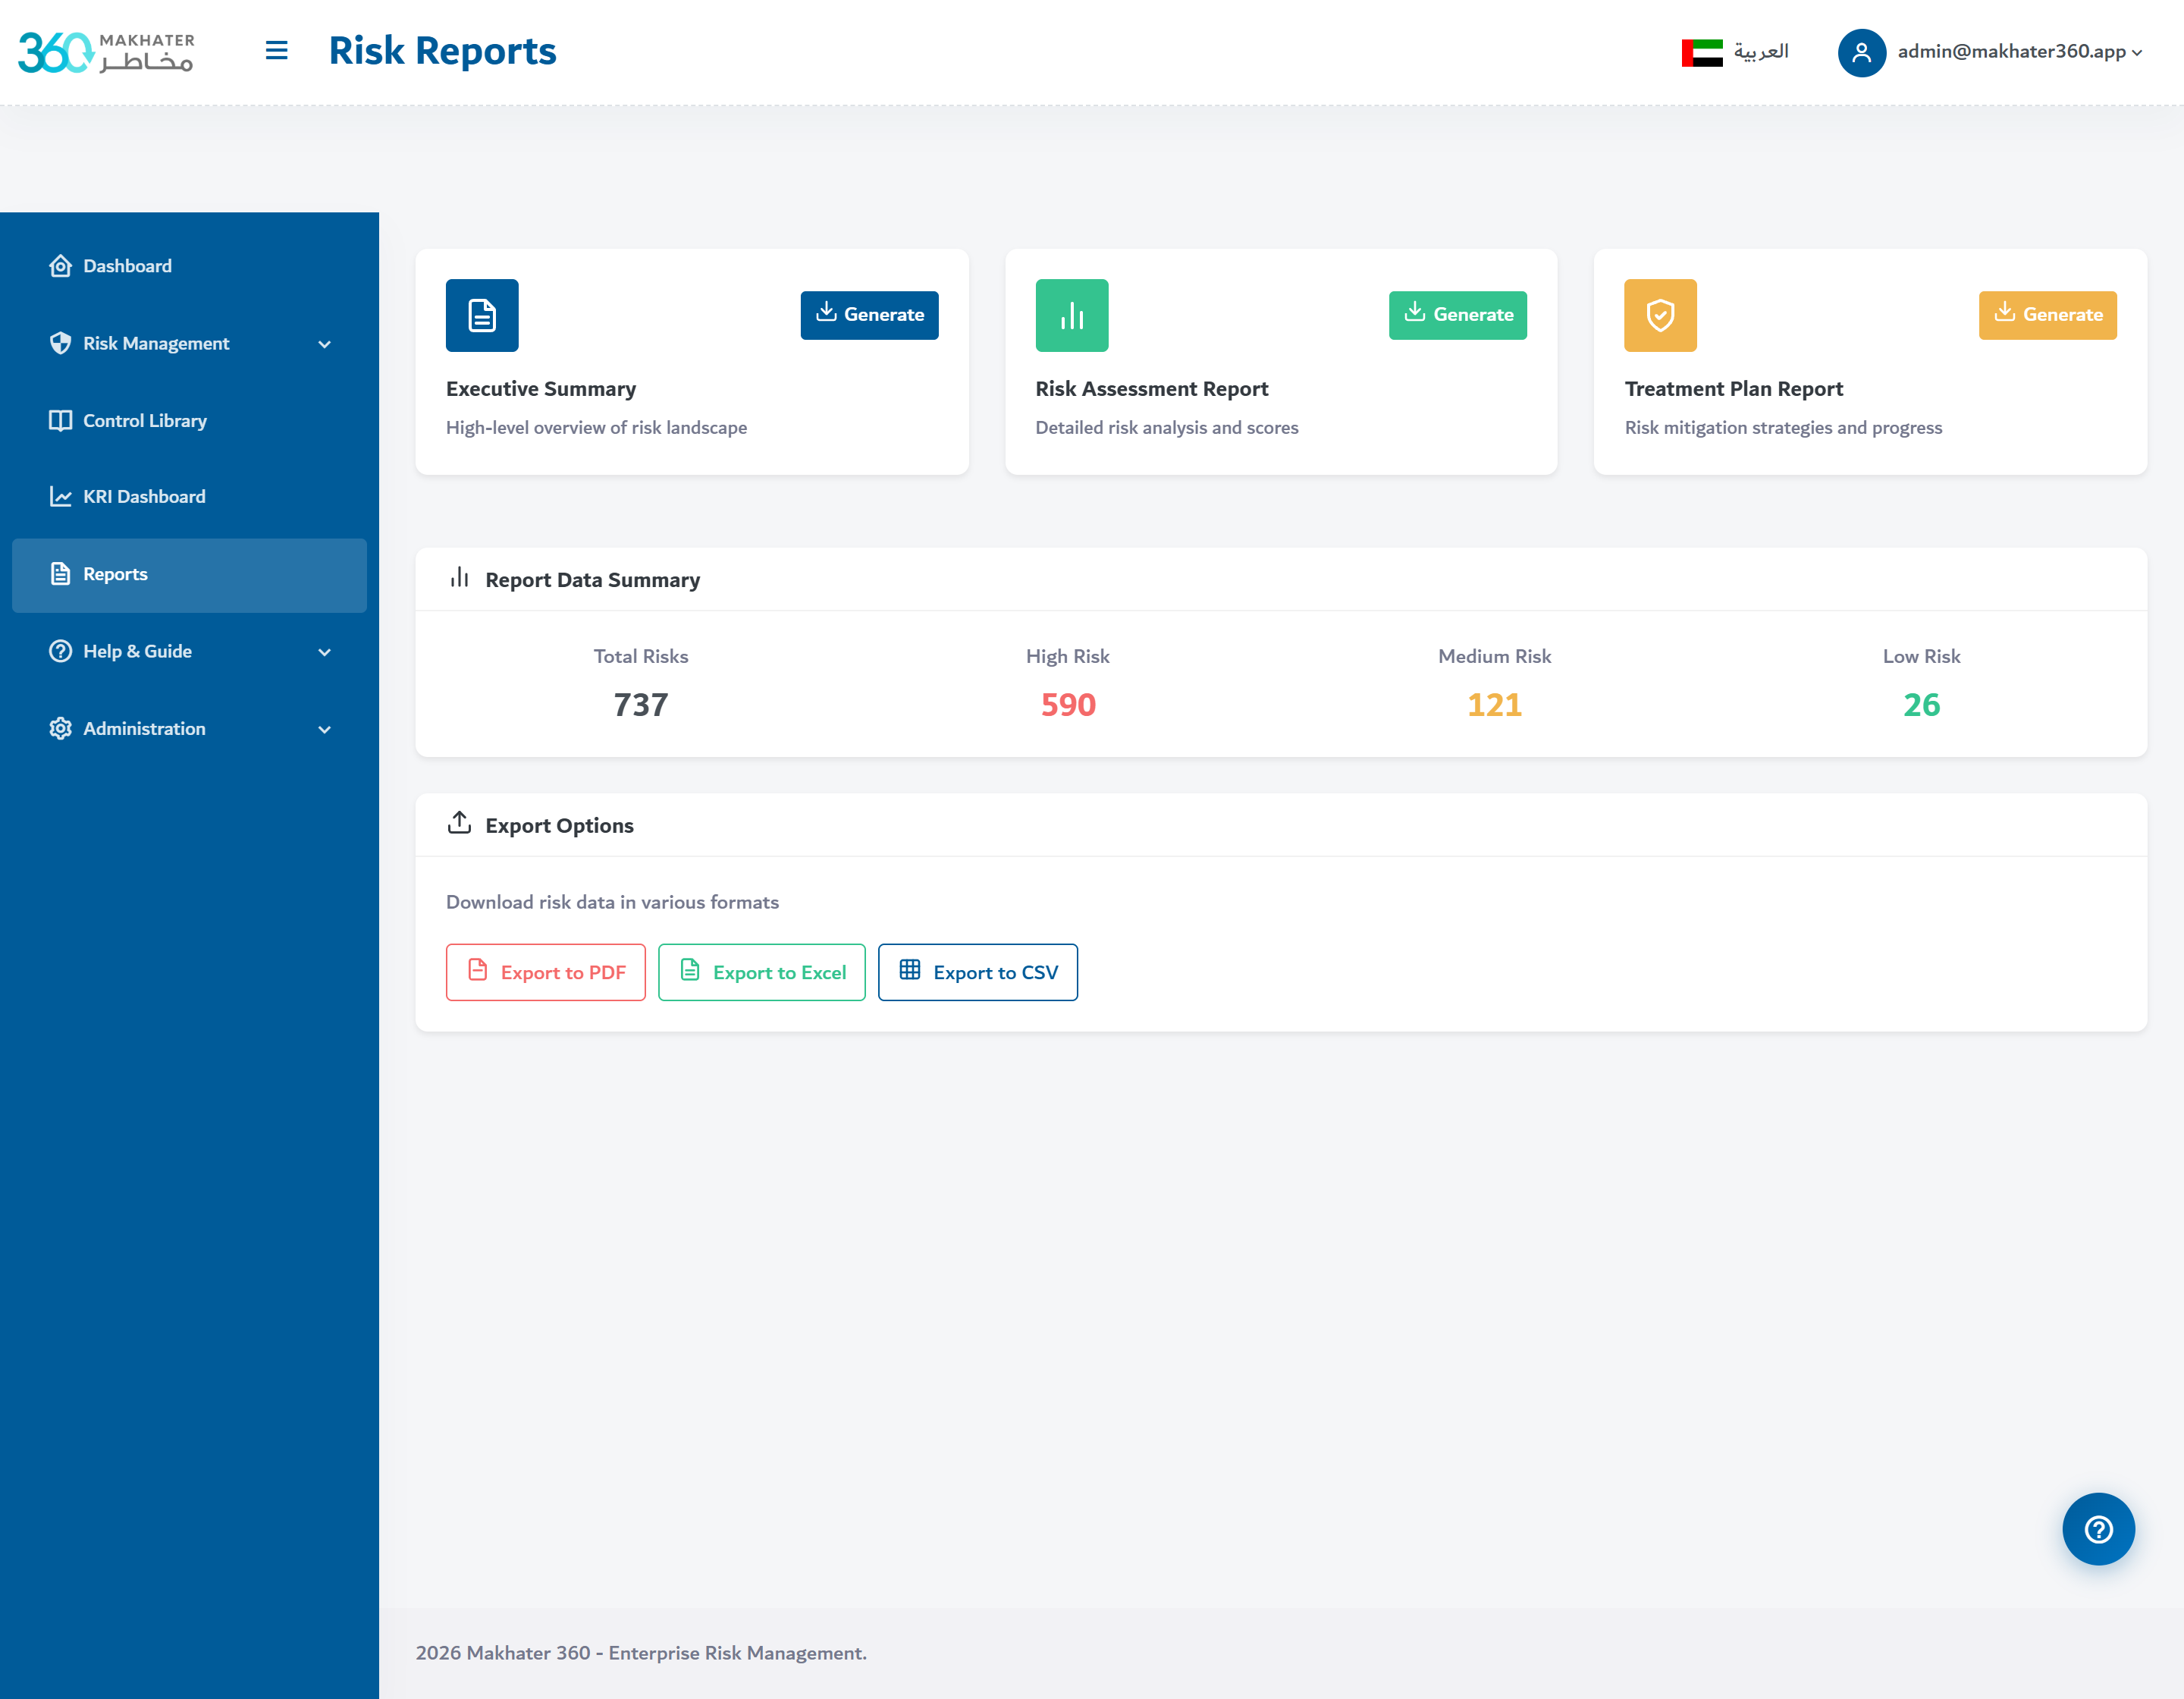
Prove It With Audit & Reporting
Every action is attributable. Organization units, role groups and a tamper-evident audit trail give auditors and leadership real-time, queryable evidence — without chasing spreadsheets.
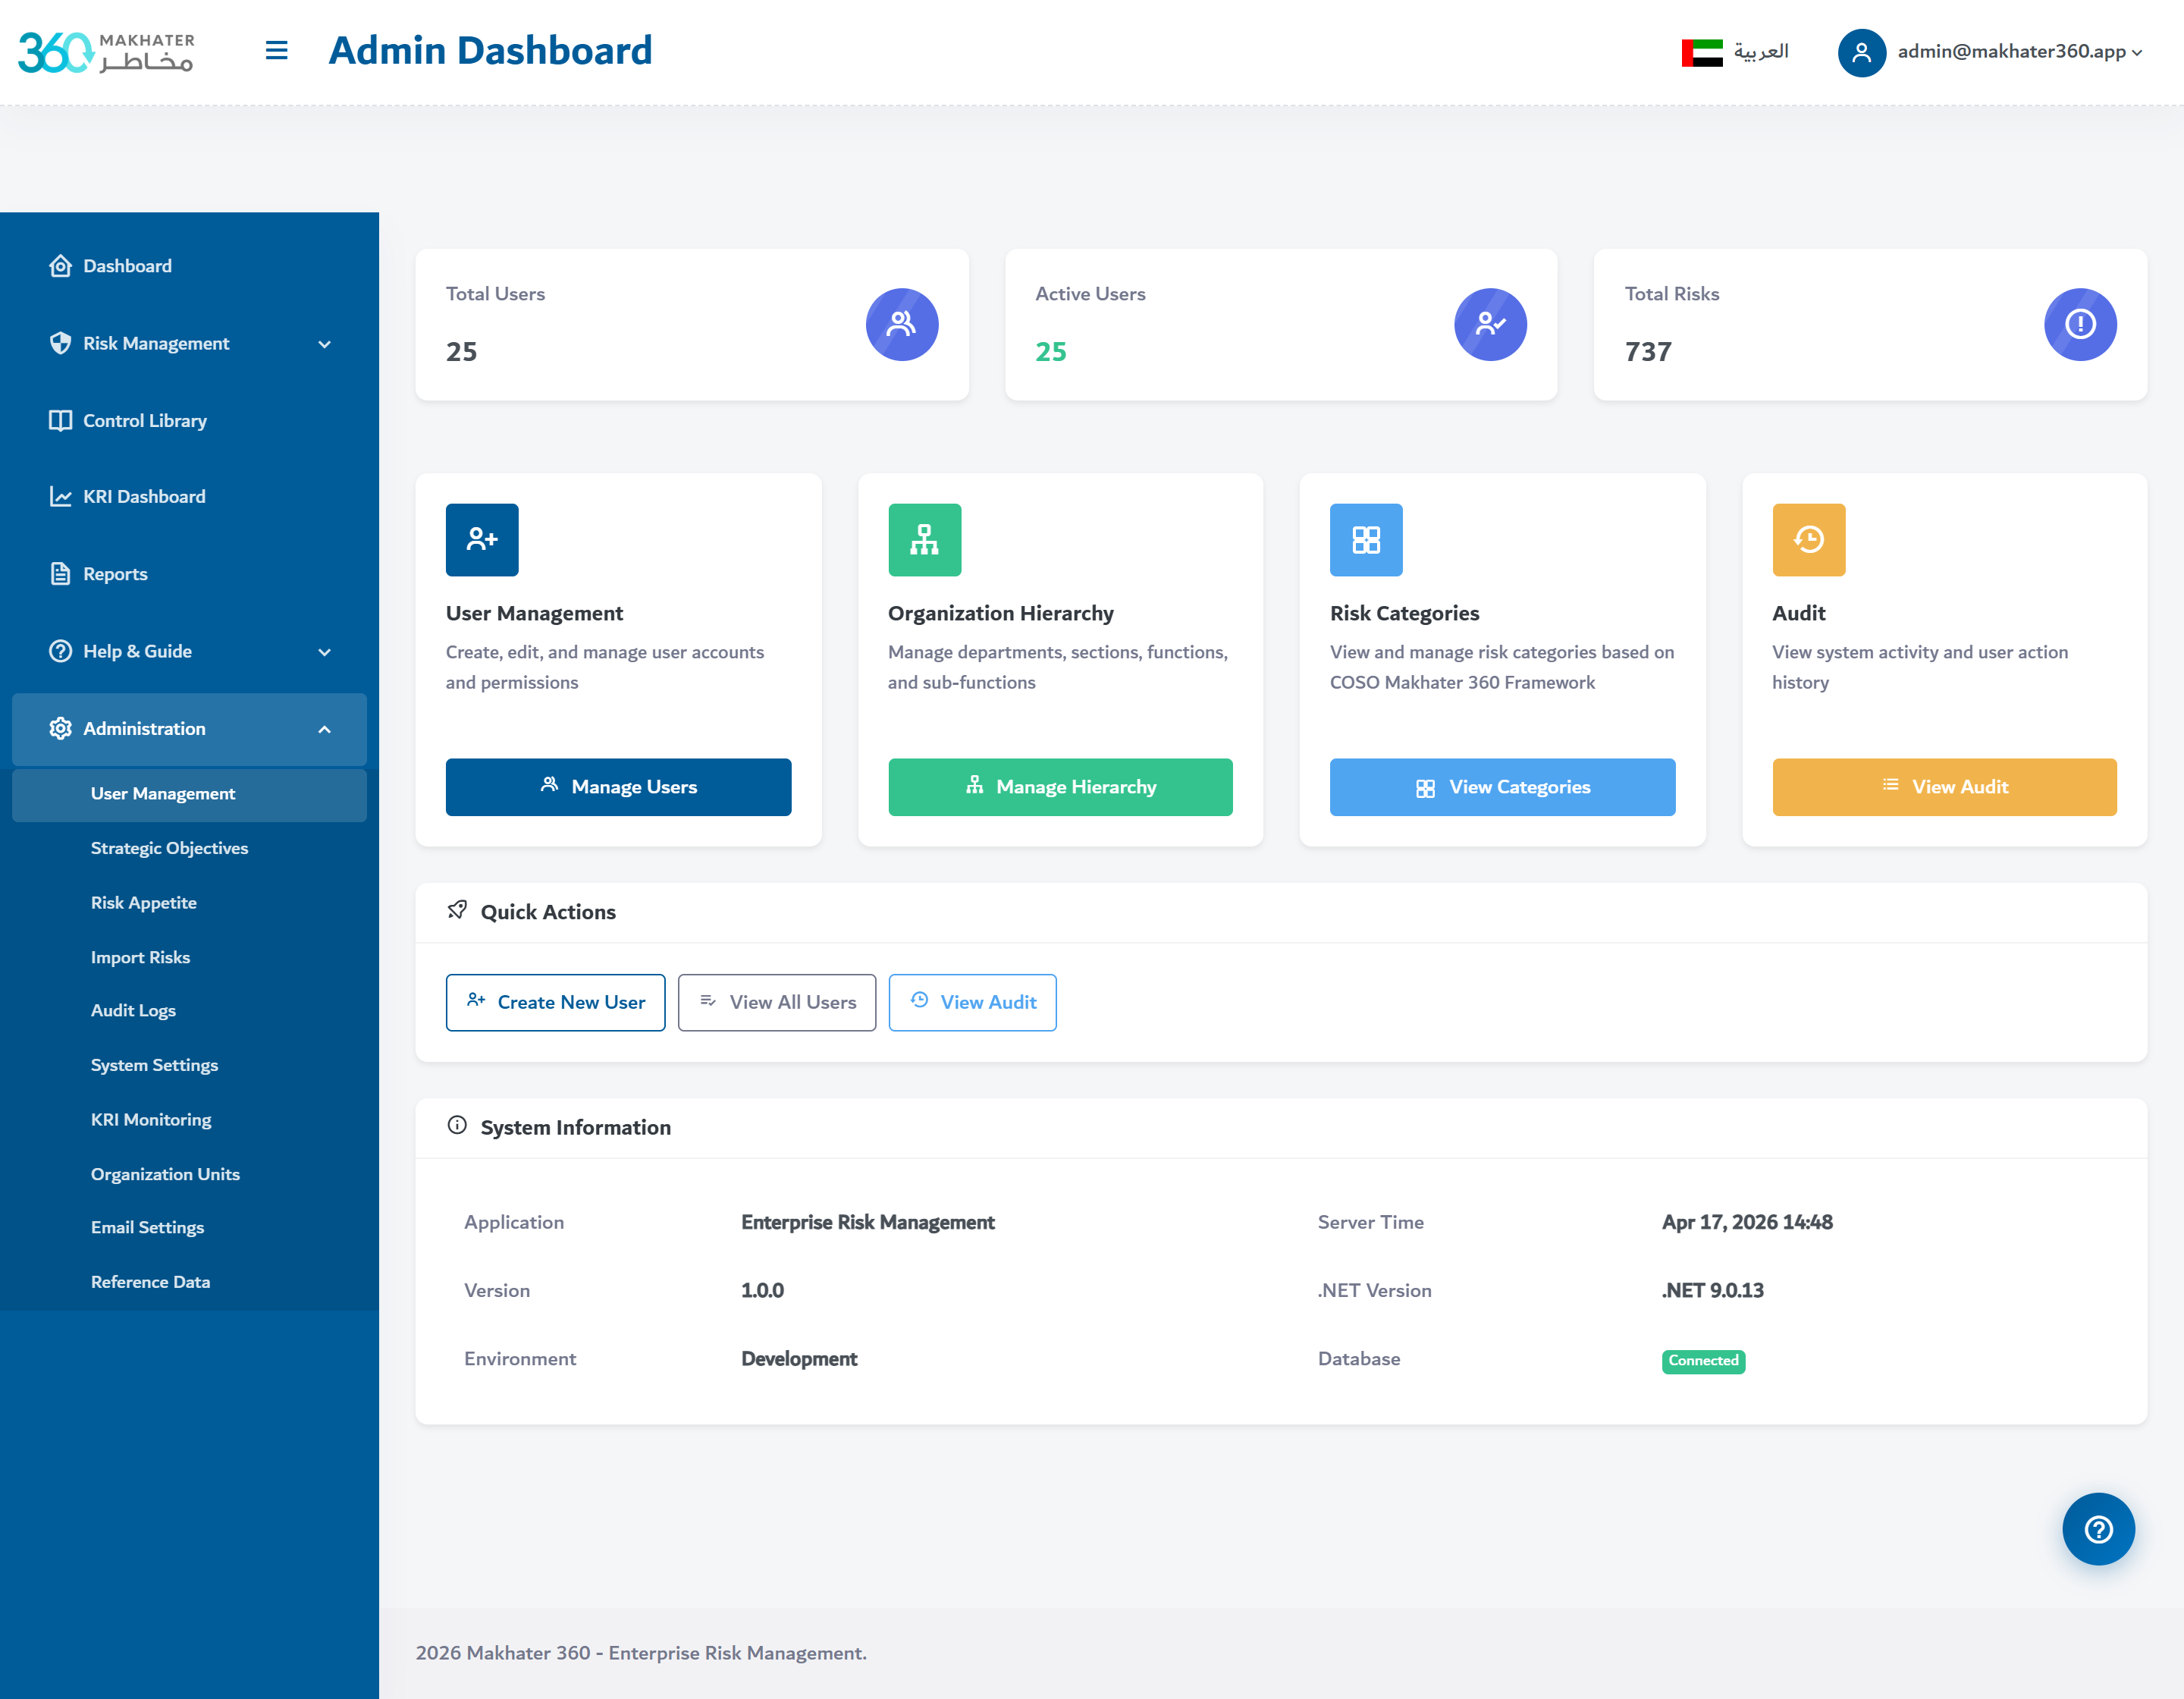
Evidence That Leadership
Can Act On
Beyond capture — Makhater 360 turns the raw risk register into the signals leadership needs to decide what to do next.
Proactive,
Auditable
The insights layer turns raw operational data into signals that guide leadership — without requiring anyone to chase spreadsheets or screenshots.
Risk Heat Map
5×5 Likelihood × Impact with outside-tolerance flags
SLA Trending
Improving, stable or breaching — classified automatically
Savings ROI
AED and hours saved, tied to individual initiatives
Impact Quadrants
Quick wins, major projects and fill-ins — triaged
Audit Forensics
Who did what, when, where — queryable on demand
Voice of Customer
Feedback tied to services and flowing into improvements
See Makhater 360 In Action
Book a personalized walkthrough and see how your risks, controls and objectives map onto Makhater 360 — in under an hour.